vqDataPlot
Plot the data and the result of vector quantization
Contents
Syntax
- vqDataPlot(data, center)
Description
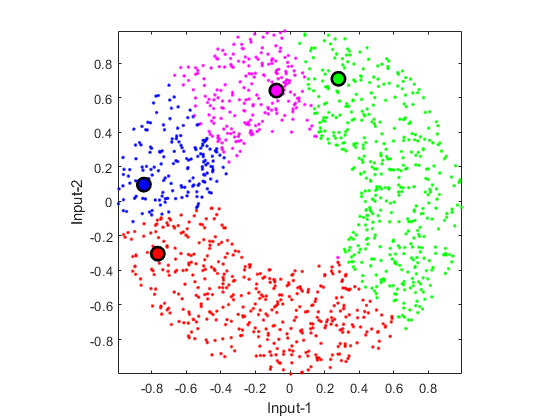
vqDataPlot(data, center) plots the scatter data during vector quantization.
This function is primarily used in kMeansClustering.m and vecQuantize.m.
Example
DS=dcData(2);
data=DS.input;
center=data(:, [10 3 9 2]);
vqDataPlot(data, center);