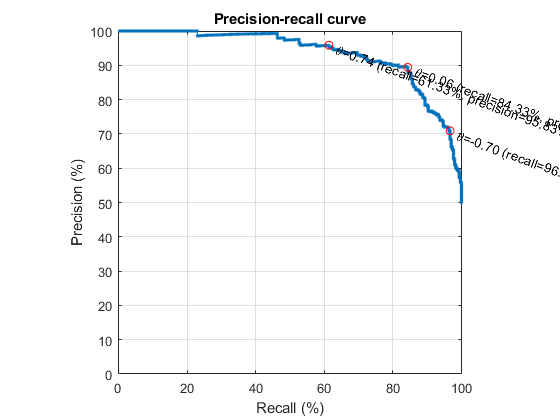
prcPlot
ROC (Receiver Operating Characteristics) curve plot for classification analysis of a single feature.
Contents
Syntax
- rocPlot(data1, data2)
- rocPlot(data1, data2, opt)
Description
|rocPlot(data1, data2)| plots the ROC (Receiver Operating Characteristics) curve for classification analysis of a single thresholds.
|detPlot(data1, data2, opt)| plots the DET with given options:
- opt.textRotation: Degrees to rotate the annotation texts
Example
data1=randn(1,300)-1;
data2=randn(1,300)+1;
opt=prcPlot('defaultOpt');
prcPlot(data1, data2, opt);