detPlotCore
Core function for plotting DET/ROC/PRC
Contents
Syntax
- detPlotCore(ths, fpr, fnr, opt)
Description
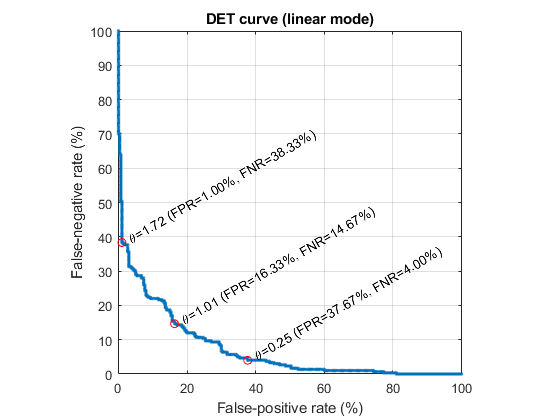
detPlotCore(ths, fpr, fnr, opt) plots the DET/ROC/PRC curve
- ths: vector of thresholds
- fpr: false positive rate (This becomes precision when opt.type='prc')
- fnr: false negative rate (this becomes recall when opt.type='prc')
- opt.type: 'det', 'roc', or 'prc'
Example
		data1=randn(1,300)-0;
		data2=randn(1,300)+2;
       [ths, fprs, fnrs, th, fp, fn, gPrm1, gPrm2, a, b]=detDataGet(data1, data2);
		opt=detPlotCore('defaultOpt');
		detPlotCore(ths, fprs, fnrs, opt);