perfAuc
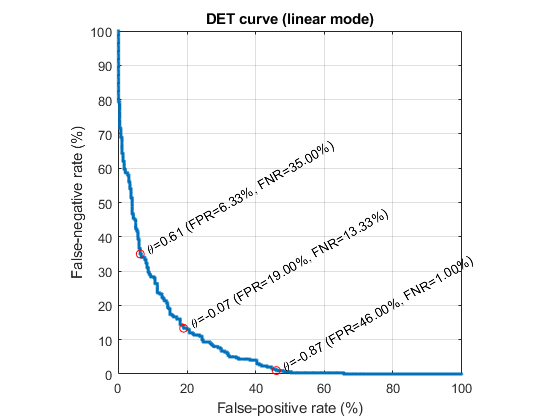
DET (Detection Error Tradeoff) plot for classification analysis of a single feature.
Contents
Syntax
- detPlot(data1, data2)
- detPlot(data1, data2, scaleMode)
Description
|detPlot(data1, data2)| plots the DET (Detection Error Tradeoff) curve for classification analysis of
a single feature. The default axis scale is linear.
If log-scale is desired, use |detPlot(data1, data2, 'log')| instead.
Example
		data1=randn(1,300)-1;
		data2=randn(1,300)+1;
		opt=perfAuc('defaultOpt');
		area=perfAuc(data1, data2, opt, 1);
       fprintf('AUC=%0.4g%%\n', area*100);
AUC=91.73%