detPlot
DET (Detection Error Tradeoff) plot for classification analysis of a single feature.
Contents
Syntax
- detPlot(data1, data2)
- detPlot(data1, data2, scaleMode)
Description
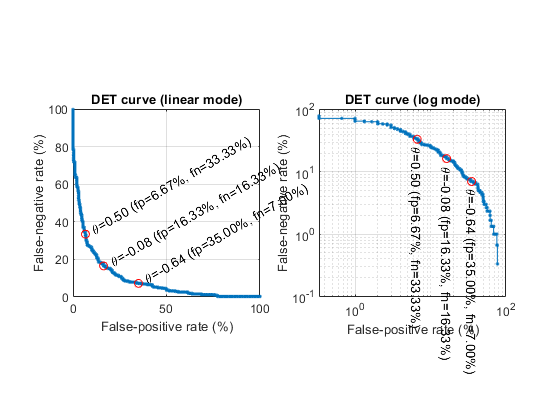
|detPlot(data1, data2)| plots the DET (Detection Error Tradeoff) curve for classification analysis of
a single feature. The default axis scale is linear.
If log-scale is desired, use |detPlot(data1, data2, 'log')| instead.
References
- A. Martin, G. Doddington, T. Kamm, M. Ordowski, and M. Przybocki, "The DET curve in assessment of detection task performance," in Proceedings of Eurospeech, Rhodes, Greece, 1997, pp. 1895-1898.
Example
data1=randn(1,300)-1;
data2=randn(1,300)+1;
opt=detPlot('defaultOpt');
subplot(1,2,1);
opt.scaleMode='linear';
detPlot(data1, data2, opt);
subplot(1,2,2);
opt.scaleMode='log';
opt.textRotation=270;
detPlot(data1, data2, opt);