gmmcPlot
Plot the results of GMMC (Gaussian-mixture-model classifier)
Contents
Syntax
- gmmcPlot(DS, gmmcPrm)
- gmmcPlot(DS, gmmcPrm, mode)
- surfObj=gmmcPlot(DS, qcPrm, ...)
Description
gmmcPlot(DS, gmmcPrm, mode) plots the results of a GMMC.
- DS: dataSet for training the GMMC
- gmmcPrm: GMMC parameters
gmmcPlot(DS, gmmcPrm, mode) uses an additional string variable to specify the type of plot
- '2dPdf' for 2D PDF plot
- '2dPosterior' for 2D posterior probability plot
- 'decBoundary' for decision boundary plot
surfObj=gmmcPlot(DS, gmmcPrm, ...) return the surface object for plotting instead of plotting directly.
Example
This example uses the Taiji dataset for classification:
DS=prData('random2');
gmmcPrm=gmmcTrain(DS);
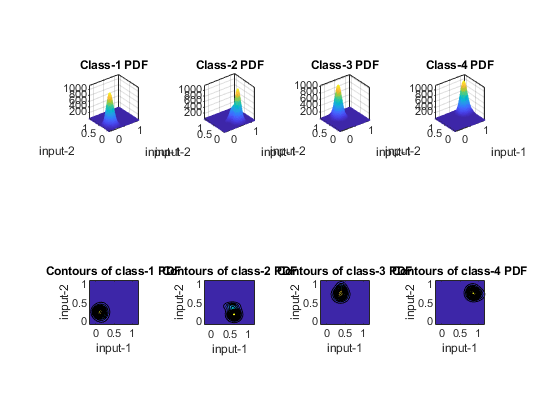
Plot 2D PDF:
figure; gmmcPlot(DS, gmmcPrm, '2dPdf');
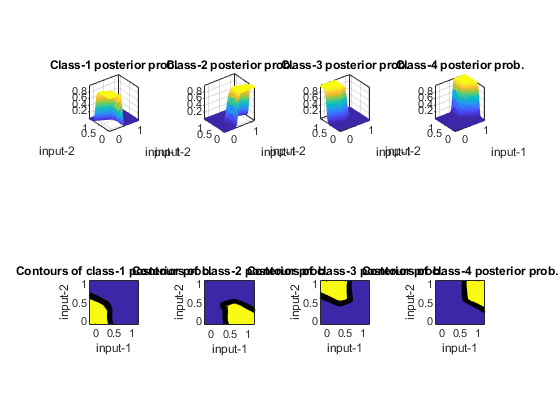
Plot 2D posterior probability:
figure; gmmcPlot(DS, gmmcPrm, '2dPosterior');
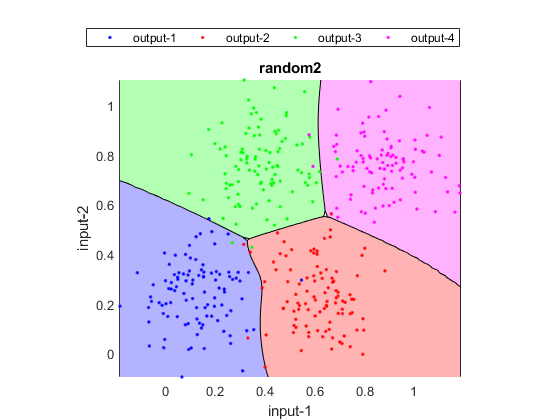
Plot decision boundary:
figure; gmmcPlot(DS, gmmcPrm, 'decBoundary');