
| MATLAB Function Reference |   |
Plot set of nodes using an adjacency matrix
Synopsis
gplot(A,Coordinates)
gplot(A,Coordinates,LineSpec)
Description
The gplot function graphs a set of coordinates using an adjacency matrix.
gplot(A,Coordinates)
plots a graph of the nodes defined in Coordinates according to the n-by-n adjacency matrix A, where n is the number of nodes. Coordinates is an n-by-2 or an n-by-3 matrix, where n is the number of nodes and each coordinate pair or triple represents one node.
gplot(A,Coordinates, plots the nodes using the line type, marker symbol, and color specified by LineSpec)
LineSpec.
Remarks
For two-dimensional data, Coordinates(i,:) = [x(i) y(i)] denotes node i, and Coordinates(j,:) = [x(j) y(j)] denotes node j. If node i and node j are joined, A(i,j) or A(j,i) are nonzero; otherwise, A(i,j) and A(j,i) are zero.
Examples
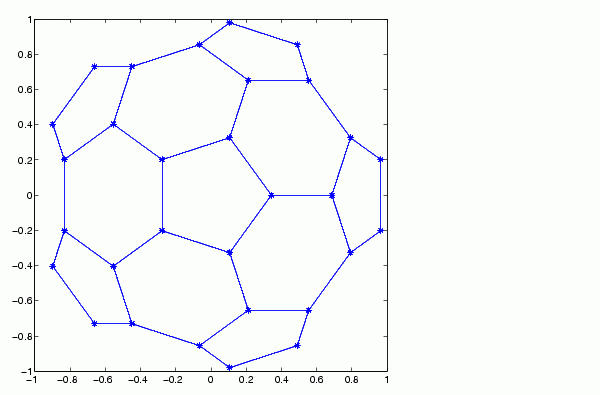
To draw half of a Bucky ball with asterisks at each node:
k = 1:30;[B,XY] = bucky; gplot(B(k,k),XY(k,:),'-*') axis square

See Also
 | gmres | gradient |  |