
| MATLAB Function Reference |   |
Syntax
mesh(X,Y,Z) mesh(Z) mesh(...,C) mesh(...,'PropertyName',PropertyValue,...) meshc(...) meshz(...) h =mesh(...) h =meshc(...) h =meshz(...)
Description
mesh, meshc, and meshz create wireframe parametric surfaces specified by X, Y, and Z, with color specified by C.
mesh(X,Y,Z)
draws a wireframe mesh with color determined by Z, so color is proportional to surface height. If X and Y are vectors, length(X) = n and length(Y) = m, where [m,n] = size(Z). In this case,
X and Y correspond to the columns and rows of Z, respectively. If X and Y are matrices,

mesh(Z)
draws a wireframe mesh using X = 1:n and Y = 1:m, where [m,n] = size(Z). The height, Z, is a single-valued function defined over a rectangular grid. Color is proportional to surface height.
mesh(...,C)
draws a wireframe mesh with color determined by matrix C. MATLAB performs a linear transformation on the data in C to obtain colors from the current colormap. If X, Y, and Z are matrices, they must be the same size as C.
mesh(...,' sets the value of the specified surface property. Multiple property values can be set with a single statement.PropertyName',PropertyValue,...)
meshc(...)
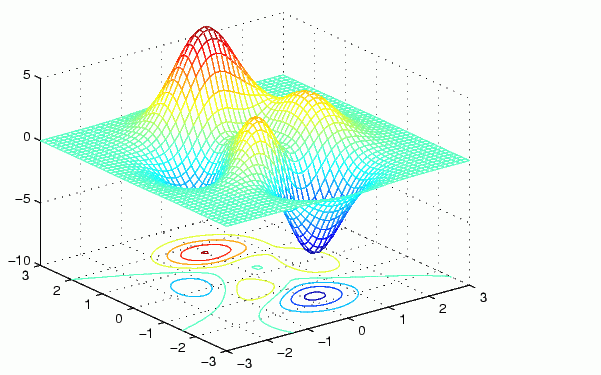
draws a contour plot beneath the mesh.
meshz(...)
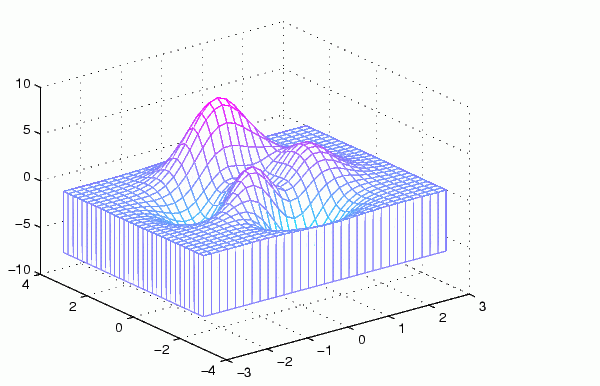
draws a curtain plot (i.e., a reference plane) around the mesh.
h = mesh(...), h = meshc(...), and h = meshz(...)
return a handle to a surface graphics object.
Remarks
A mesh is drawn as a surface graphics object with the viewpoint specified by view(3). The face color is the same as the background color (to simulate a wireframe with hidden-surface elimination), or none when drawing a standard see-through wireframe. The current colormap determines the edge color. The hidden command controls the simulation of hidden-surface elimination in the mesh, and the shading command controls the shading model.
Examples
Produce a combination mesh and contour plot of the peaks surface:
[X,Y]=meshgrid(-3:.125:3); Z =peaks(X,Y); meshc(X,Y,Z); axis([-33-33-105])

Generate the curtain plot for the peaks function:
[X,Y]=meshgrid(-3:.125:3); Z =peaks(X,Y); meshz(X,Y,Z)

Algorithm
The range of X, Y, and Z, or the current setting of the axes XLimMode, YLimMode, and ZLimMode properties determine the axis limits. axis sets these properties.
The range of C, or the current setting of the axes CLim and CLimMode properties (also set by the caxis function), determine the color scaling. The scaled color values are used as indices into the current colormap.
The mesh rendering functions produce color values by mapping the z data values (or an explicit color array) onto the current colormap. MATLAB's default behavior computes the color limits automatically using the minimum and maximum data values (also set using caxis auto). The minimum data value maps to the first color value in the colormap and the maximum data value maps to the last color value in the colormap. MATLAB performs a linear transformation on the intermediate values to map them to the current colormap.
meshc calls mesh, turns hold on, and then calls contour and positions the contour on the x-y plane. For additional control over the appearance of the contours, you can issue these commands directly. You can combine other types of graphs in this manner, for example surf and pcolor plots.
meshc assumes that X and Y are monotonically increasing. If X or Y is irregularly spaced, contour3 calculates contours using a regularly spaced contour grid, then transforms the data to X or Y.
See Also
contour, hidden, meshgrid, sruface, surf, surfc, surfl, waterfall
The functions axis, caxis, colormap, hold, shading, and view all set graphics object properties that affect mesh, meshc, and meshz.
For a discussion of parametric surfaces plots, refer to surf.
 | menu | meshgrid |  |