
| MATLAB Function Reference |   |
Syntax
legend('string1','string2',...)
legend(h,'string1','string2',...)
legend(string_matrix)
legend(h,string_matrix)
legend(axes_handle,...)
legend('off')
legend(h,...)
legend(...,pos)
h = legend(...)
[legend_handle,object_handles] = legend(...)
Description
legend
在不同類型的圖像(線平面圖,條狀圖像,圖形流程圖等)放置說明。對於線條平面圖而言,將針對線條類型、標示符號、定義的文字標示顏色顯示說明。對於填滿的平面區域(斑點或表面物件),說明將包含表面顏色及文件標示。
legend(' 針對每一資料依所定義的字串於現行軸心圖中顯示說明。 string1','string2',...)
legend(h,' 在平面圖中顯示包含向量 string1','string2',...)
h
中頭銜的說明,使用定義的字串標示對應的圖像物件(線,條等)。
legend(string_matrix)
增加一包含矩陣 string_matrix 以當做標示的說明。等同於 legend(string_matrix(1,:),string_matrix(2,:),...)。
legend(h,string_matrix)
將矩陣 string_matrix 的列依向量 h
對應於相關圖像物件。
legend(axes_handle,...)
藉由 axes_handle 顯示軸的說明。
legend('off'),legend(axes_handle,'off')
藉由 axes_hanlde 移除軸的說明。
legend_handle = legend
回傳現行軸說明的頭銜,若無說明,則回傳空向量。
legend(legend_handle)
更新定義的說明。
legend(...,pos)
使用 pos 來決定放置說明的位置。
pos = -1 放置說明在軸線右邊線的外面。pos = 0 放置說明在軸線內側,儘可能的不顯著。pos = 1 放置說明在軸線的右上方(預設值)。pos = 2 放置說明在軸線的左上方。pos = 3 放置說明在軸線的左下方。pos = 4 放置說明在軸線的右下方。[legend_handle,object_handles] = 回傳說明(legend(...)
legend_handle)的頭銜,其說明為一軸心圖像物件而頭銜為 line。斑點和 text
圖像物件(object_handles)用於說明中。這些頭銜讓使用者可修改相關物件的屬性。
Remarks
legend 關聯於物件在軸中的字串並等同於在軸 Children
屬性中的次序。預設值為說明註解於現行的軸。
MATLAB 對每一軸僅顯示一個說明。legend
依據其不同的因子放置說明的位置,如同物件的隱藏。使用者可藉由滑鼠左鍵的拖曳移動說明。雙擊標示則可以編輯該標示。
Examples
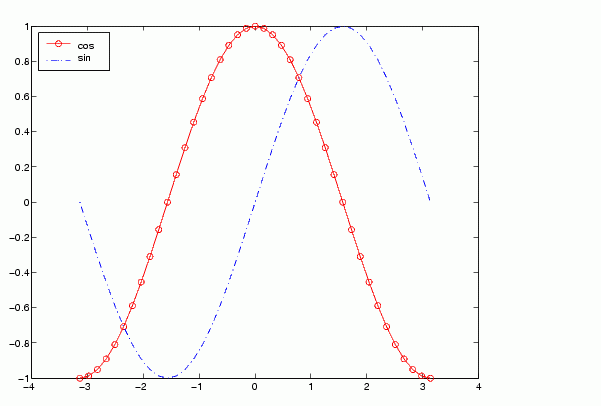
x =-pi:pi/20:pi;plot(x,cos(x),'-ro',x,sin(x),'-.b')h = legend('cos','sin',2);

在這個範例中,指令 plot 對函式
cosine 定義一實心的紅線 ('-r') 而對函式 sine 定義一藍色的虛線 ('-.b')。
See Also
 | lcm | legendre |  |