dtwPathPlot
Plot the resultant path of DTW of two vectors
Contents
Syntax
- dtwPathPlot(vec1, vec2, dtwPath)
Description
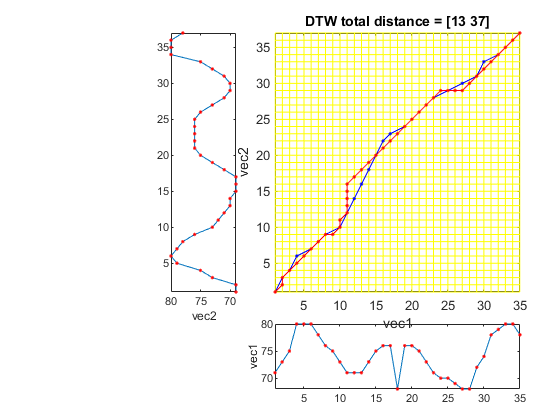
dtwPathPlot(vec1, vec2, dtwPath) plots the DTW path dtwPath between two vectors vec1 and vec2.
Note that dtwPath must be obtained in advance, by any one of the DTW commands in the toolbox.
In fact, to plot multiple paths, dtwPath could be a cell array containing several DTW paths obtained from different versions of DTW.
dtwPathPlot(vec1, vec2, dtwPath, 'square') displays the DTW table as a square region for easy viewing.
Example
This example compares the optimum paths of type-1 and type-2 DTW.
vec1=[71 73 75 80 80 80 78 76 75 73 71 71 71 73 75 76 76 68 76 76 75 73 71 70 70 69 68 68 72 74 78 79 80 80 78];
vec2=[69 69 73 75 79 80 79 78 76 73 72 71 70 70 69 69 69 71 73 75 76 76 76 76 76 75 73 71 70 70 71 73 75 80 80 80 78];
dtwOpt=dtwOptSet;
dtwOpt.type=1;
[minDist1, dtwPath1, dtwTable1]=dtw(vec1, vec2, dtwOpt);
dtwOpt.type=2;
[minDist2, dtwPath2, dtwTable2]=dtw(vec1, vec2, dtwOpt);
dtwPathPlot(vec1, vec2, {dtwPath1, dtwPath2});
See Also
dtwPathPlot, dtw1, dtw2, dtw3.