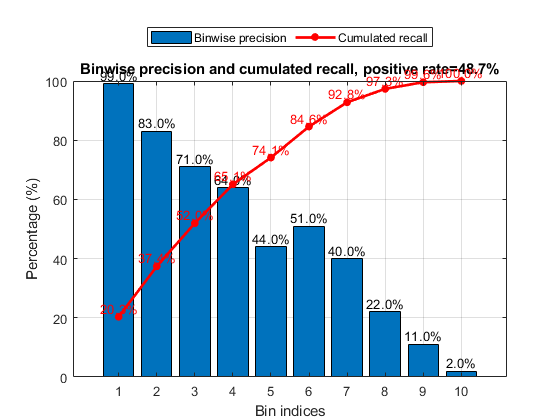
liftChart
Lift chart
Contents
Syntax
- [binPrecision, cumRecall, binSize]=liftChart(logLike, gt, opt, showPlot)
Description
[binPrecision, cumRecall binSize]=liftChart(logLike, gt, opt, showPlot)
- logLike: the bigger, the more likely the data is in class 2 (positive cases)
- gt: groundtruth
Example
n=1000;
logLike=randn(n, 1);
gt=1+(logLike>0);	% 1 or 2
logLike=logLike+0.9*randn(n,1);	% Make it not perfect
opt=liftChart('defaultOpt');
liftChart(logLike, gt, opt, 1);