hierClusteringPlot
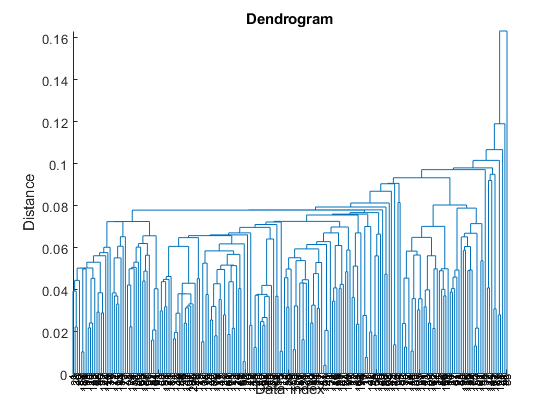
Plot of the result from agglomerative hierarchical clustering, also known as dendrogram
Contents
Syntax
- hierClusteringPlot(level)
- level: the hierarchical clustering output from hierClustering
Description
hierClusteringPlot(level) plots the output of hierarchical clustering.
Example
This example plots the dendrogram:
data=rand(2, 200);           		% 200 data instances of dim 2
distMat=distPairwise(data, data);	% Distance matrix of 50 by 50
hcOutput=hierClustering(distMat);
figure; hierClusteringPlot(hcOutput);		% Plot the dendrogram
We can also show the animation during clustering:
figure; hierClusteringAnim(data, distMat, hcOutput);
