gaussian
Multi-dimensional Gaussian propability density function
Contents
Syntax
- out = gaussian(data, gPrm)
Description
out=gaussian(data, gPrm) return the probability of given data over Gaussian PDF with parameter gPrm.
- data: d x n data matrix, representing n data vector of dimension d
- gPrm.mu: d x 1 vector
- gPrm.sigma: covariance matrix of 3 possible sizes
- 1 x 1: scalar times an identity matrix
- d x 1: diagonal
- d x d: full
- out: 1 x n vector of likelihood
Example
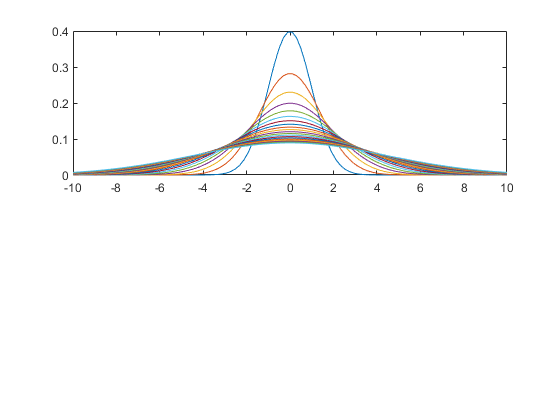
Plot 1-D Gaussians
x=linspace(-10, 10);
subplot(2,1,1);
gPrm.mu=0;
hold on
for i=1:20
	gPrm.sigma=i;
	y=gaussian(x, gPrm);
	plot(x,y);
end
hold off; box on
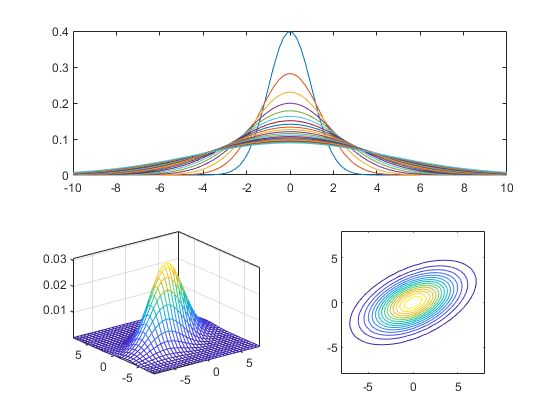
Plot 2-D Gaussians
gPrm.mu=[0; 0];
gPrm.sigma=[9 3; 3, 4];
bound=8;
pointNum=31;
x = linspace(-bound, bound, pointNum);
y = linspace(-bound, bound, pointNum);
[xx, yy] = meshgrid(x, y);
data = [xx(:), yy(:)]';
out = gaussian(data, gPrm);
zz = reshape(out, pointNum, pointNum);
subplot(2,2,3);
mesh(xx, yy, zz); box on
axis([-inf inf -inf inf -inf inf]);
subplot(2,2,4);
contour(xx, yy, zz, 15);
axis image;
Check integration
gPrm.mu=1;
gPrm.sigma=2;
area = quad('gaussian', -10, 10, [], [], gPrm);
fprintf('The integration from -10 to 10 for a Gaussian is %g.\n', area);
The integration from -10 to 10 for a Gaussian is 1.