dsScatterPlot3
Scatter plot of the first 3 dimensions of the given dataset
Contents
Syntax
- dsScatterPlot3(DS)
Description
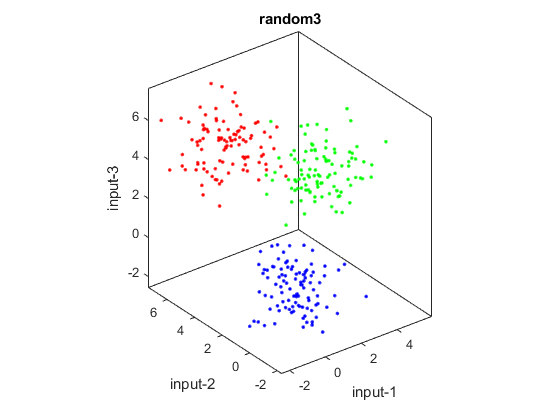
dsScatterPlot3(DS) give a 3D scatter plot of the dataset stored in DS.
- DS: data to be displayed
- DS.input: input part
- DS.output: output part (this part could be missing for DC)
- DS.dataName: data name (or description)
- DS.inputName: data input name
- DS.annotation: data annotation for each data point
You can click and drag the mouse to change the viewing angle.
Example
DS=prData('random3');
dsScatterPlot3(DS);