dsCorrPlot
Box plot for a dataset
Contents
Syntax
- dsCorrPlot(DS)
Description
dsCorrPlot(DS) plots the features of each class as a box plot to show the features' distributions.
Example
DS=prData('iris');
dsCorrPlot(DS);
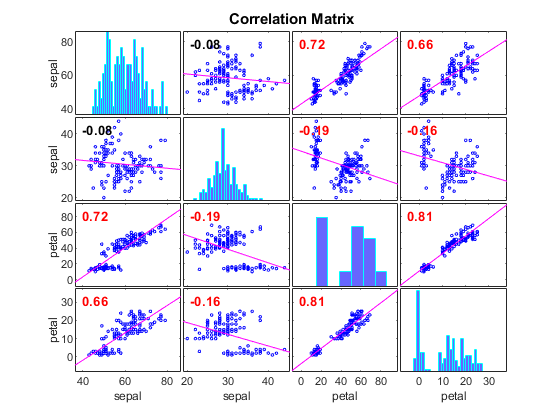
Box plot for a dataset
dsCorrPlot(DS) plots the features of each class as a box plot to show the features' distributions.
DS=prData('iris');
dsCorrPlot(DS);