decisionBoundaryPlot
Plot of the decision boundary of a classifier
Contents
Syntax
- patchH=decisionBoundaryPlot(surfObj, DS)
Description
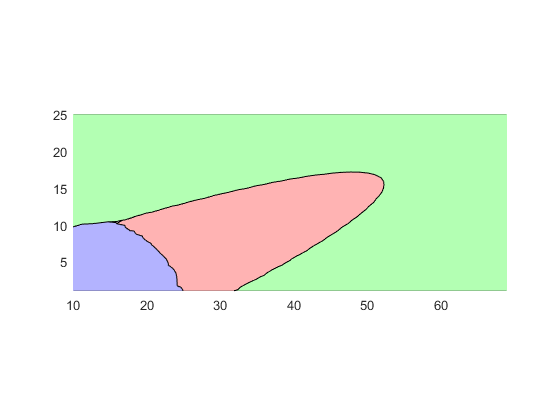
patchH=decisionBoundaryPlot(surfObj, DS) plots the decision boundary of a classifier.
Example
DS=prData('iris');
DS.input=DS.input(3:4, :);			% Only take dimensions 3 and 4 for 2d visualization
[qcPrm, logProb, recogRate]=qcTrain(DS);
surfObj=qcPlot(DS, qcPrm);			% Compute the Gaussian pdf for each class
decisionBoundaryPlot(surfObj);			% Plot the decision boundary