classifierPlot
Plot the results of a given classifier after training
Contents
Syntax
- classifierPlot(classifier, DS, cPrm)
- classifierPlot(classifier, DS, cPrm, mode)
- surfObj=classifierPlot(classifier, DS, cPrm, ...)
Description
classifierPlot(classifier, DS, cPrm) plots the training results of a given classifier.
- classifier: a string specifying a classifier
- classifier='qc' for quadratic classifier
- classifier='nbc' for naive Bayes classifier
- classifier='gmmc' for GMM classifier
- classifier='linc' for linear classifier
- classifier='knnc' for k-nearest-neighbor classifier
- DS: dataset used for training the classifier
- cPrm: parameters of the classifier
classifierPlot(classifier, DS, cPrm, mode) uses a string variable to specify the plot mode
- mode='1dPdf' for 1D PDF plot (for nbc only)
- mode='2dPdf' for 2D PDF plot
- mode='2dPosterior' for 2D posterior probability plot
- mode='decBoundary' for decision boundary plot
surfObj=classifierPlot(classifier, DS, cPrm, ...) return the surface object for plotting instead of plotting directly.
Example
1-D PDF plot for a naive Bayes classifier:
DS=prData('3classes');
classifier='nbc';
cPrm=classifierTrain(classifier, DS);
figure; classifierPlot(classifier, DS, cPrm, '1dPdf');

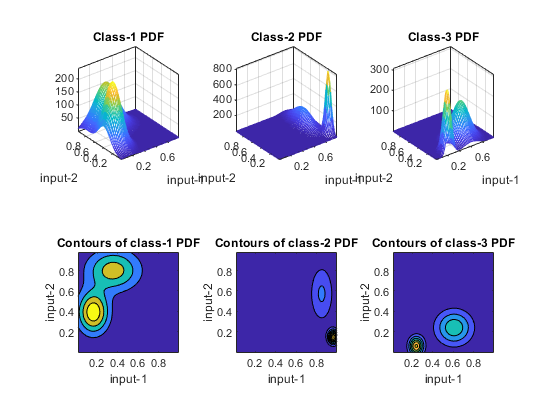
2-D PDF plot for a GMM classifier:
DS=prData('3classes');
classifier='gmmc';
cPrm=classifierTrain(classifier, DS);
figure; classifierPlot(classifier, DS, cPrm, '2dPdf');
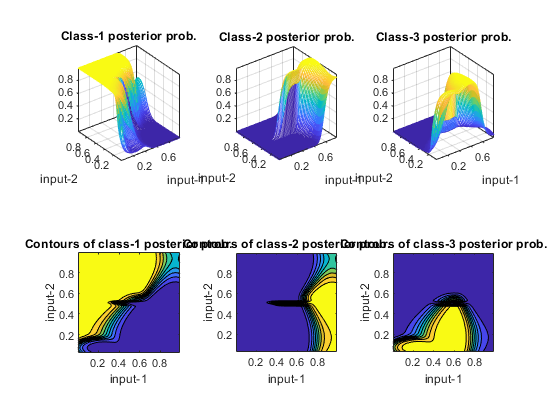
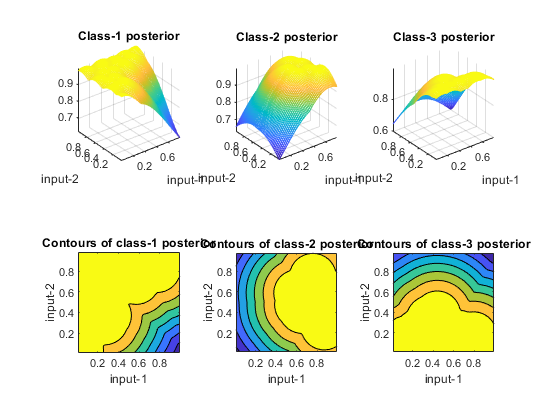
2-D posterior prob. plot for a GMM classifier:
DS=prData('3classes');
classifier='gmmc';
cPrm=classifierTrain(classifier, DS);
figure; classifierPlot(classifier, DS, cPrm, '2dPosterior');
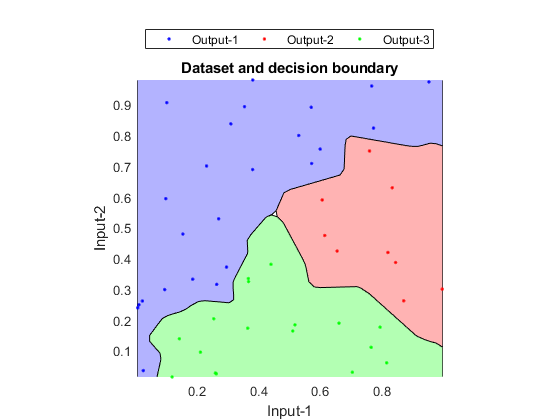
Decision boundary plot for a GMM classifier:
DS=prData('3classes');
classifier='gmmc';
cPrm=classifierTrain(classifier, DS);
figure; classifierPlot(classifier, DS, cPrm, 'decBoundary');
For KNNC
classifier='knnc';
[trainSet, testSet]=prData('3classes');
cPrm=knncTrain(trainSet);
cPrm.k=1;
Plot 2D posterior-like function:
figure; classifierPlot(classifier, trainSet, cPrm, '2dPosterior');
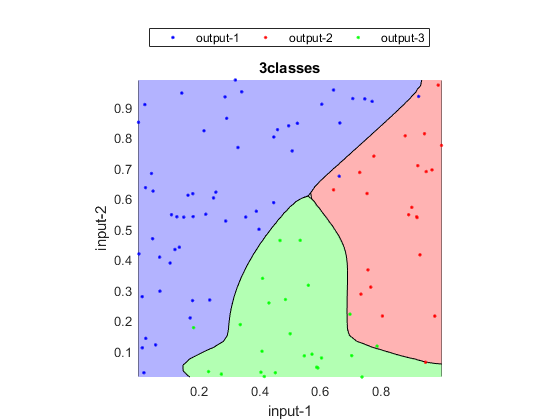
Plot decision boundary:
figure; classifierPlot(classifier, trainSet, cPrm, 'decBoundary');