| MATLAB Function Reference | |
以圓錐體(cones)的方式在三維(3-D)的向量領域(vector field)中繪出速度向量(velocity vectors)。
Syntax
coneplot(X,Y,Z,U,V,W,Cx,Cy,Cz)
coneplot(U,V,W,Cx,Cy,Cz)
coneplot(...,s)
coneplot(...,color)
coneplot(...,'quiver')
coneplot(...,'method')
coneplot(X,Y,Z,U,V,W,'nointerp')
h = coneplot(...)
Description
coneplot(X,Y,Z,U,V,W,Cx,Cy,Cz)利用圓錐體(cones)來繪出速度向量(velocity vectors),並利用圓錐體(cones)本身指出速度向量(velocity vectors)的方向(direction)同時圓錐體的長度(length)和速度向量的量(matnitude)成一定的比例(proportional)。
X, Y, Z為向量領域(field)訂立座標(coordinates)。.U, V, W定義向量領域(field)。這些陣列一定要是同樣大小(size)、單調的(monotonic)同時也是三維格狀(3-D plaid)(像是meshgrid所產生的資料。)。Cx, Cy, Cz定義圓錐體的在空間領域的位置。在形象化技巧理的(visiualization techniques)串流繪圖的起點(Starting Points for Stream Plots)這一節,提供更多有關定義起點(starting points)的消息。coneplot(U,V,W,Cx,Cy,Cz)(省略了X、Y和Z三個參數)假設[X,Y,Z] = meshgrid(1:n,1:m,1:p)同時[m,n,p]= size(U)。
coneplot(...,s)MATLAB自動的調整(scales)圓錐的大小(scales)去適合圖表(graph),同時以s的比例係數(scale factor)伸縮(stretches)他們。如果以沒有明確說明一個變數s的值,則MATLAB會使用1作為變數s的值。使用s= 0來避免自動的對圓錐體做大小(scale)的改變。
coneplot(...,color)
插入(interpolates)陣列color到向量領域()之中,則在對圓錐體上色(color)的時候就會依照插入(interpolated)的值來決定。color陣列的大小(size)必須要和U、V、W陣列一樣。這個選項(option)只有在圓錐體上才會有效(work)(例如:不會在quiver選項(option)有效)。
coneplot(...,'quiver')畫出箭頭代替圓錐體。(請參考quiver3來獲得劍型(quiver)繪圖(plot)的圖解(illustration)。)
coneplot(...,'method')明確說明(specifies)將要使用的插補(interpolation)方法。method可以是:linear、cubic、nearest。linear是預設的(請參考interp3來獲得更多有關於差補方法(interpolation methods)的討論(discussion))。
coneplot(X,Y,Z,U,V,W,'nointerp')
不會串改圓錐體的位置到體積之中(does not interpolate the positions of the cones into the volume)。圓錐體將會被畫(drawn)在由X、Y、Z所定義的位置(position),同時會依照U、V、W來導向(oriented)。陣列X、Y、Z、U、V、W一定要相同大小(size)。
h = coneplot(...)傳回土地(patch)物件(object)用來畫圓錐的控制(handle)。你可以使用set指令(command)去改變圓錐體的屬性(properties)。
Remarks
coneplot自動的改變圓錐的比例(scales)來適合圖表,同時保持他們每個速度向量各自的比例(proportion)。
通常最好在呼叫coneplot先設定軸在資料外觀上的比例(the data aspect ratio of the axes)。你可以使用設定daspect指令(command)來設定比例(ratio)。
daspect([1,1,1])
Examples
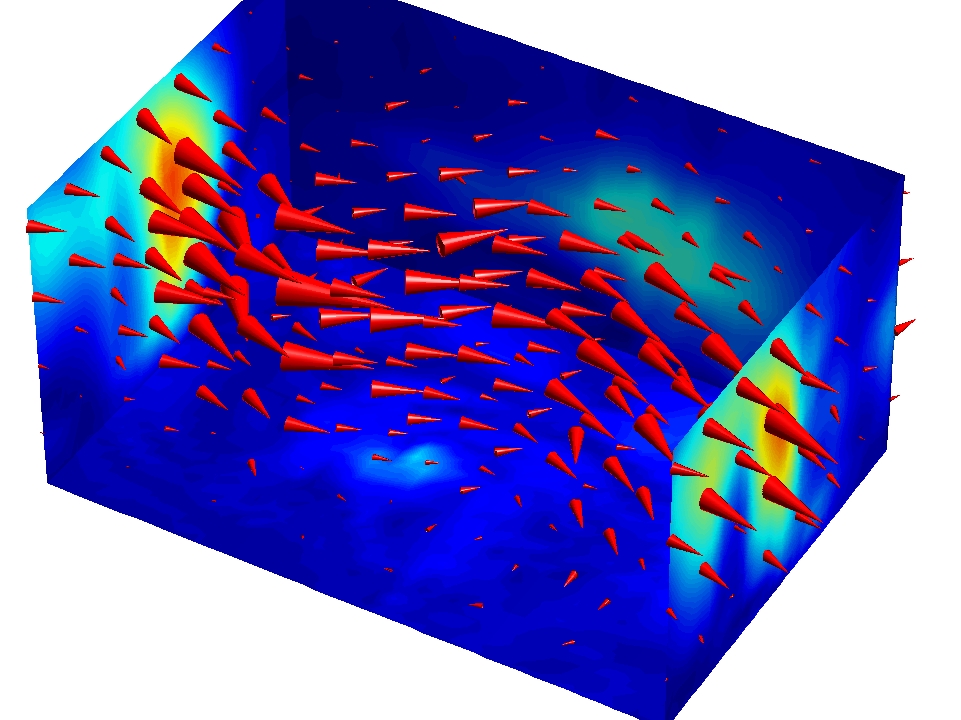
這個範例將會為向量體積(vector volume)資料畫出速度(velocity)向量(vector)圓錐(cones),來表示在一個矩形區域的空間(space)中空氣流動(motion)的情況。最後的圖表(graph)使用了許多提高(enhancements)來更有效的視覺化(visualize)資料。這些包含了:
1. 載入和審查資料(Load and Inspect Data)
風的資料集(data set)包含了六個三維(3-D)的陣列:u、v和w。這三個陣列明確的說明了向量組成要素在三個座標軸上的位置,利用x、y和z來明確說明。座標軸定義了一個格子狀(lattice grid)的結構(structure)其中資料會在體積中被取樣(sampled)。(The coordinates define a lattice grid structure where the data is sampled within the volume)
放置(place)切片平面(slice planes)和明確說明哪裡使用者要有圓錐體畫圖對於建立資料的範圍是很有幫助的(useful)。(min, max)。
load wind
xmin = min(x(:));
xmax = max(x(:));
ymin = min(y(:));
ymax = max(y(:));
zmin = min(z(:));
2. 創造圓錐繪圖(Create the Cone Plot)
linspace,meshgrid)。coneplot之前使用daspect來設定資料外觀(aspect)所有軸的比例(ratio),使得MATLAB可以決定出適當的圓錐體大小。FaceColor、EdgeColor).daspect([2,2,1]) xrange = linspace(xmin,xmax,8); yrange = linspace(ymin,ymax,8); zrange = 3:4:15; [cx cy cz] = meshgrid(xrange,yrange,zrange); hcones = coneplot(x,y,z,u,v,w,cx,cy,cz,5); set(hcones,'FaceColor','red','EdgeColor','none')
3. Add the Slice Planes
slice使用。xmin和xmax,還有y軸(y-axis)在ymax,以及z軸(z-axis)在zmin創造(create)切片(slice)平面(planes)。hold、slice、FaceColor、EdgeColor)。hold on wind_speed = sqrt(u.^2 + v.^2 + w.^2); hsurfaces = slice(x,y,z,wind_speed,[xmin,xmax],ymax,zmin); set(hsurfaces,'FaceColor','interp','EdgeColor','none') hold off
4. 定義觀看景(Define the View)
axis指令去設定軸的極限(limits)等於資料的範圍。view為azimuth = 30和elevation = 40 (rotate3d再選擇最佳觀看景是一個很有用的指令。)。 camproj)。camzoom)。axis tight; view(30,40); axis off camproj perspective; camzoom(1.5)
5. 增加景象的打光(Add Lighting to the Scene)
光源(light source)同時影響切片平面(slice planes)(surfaces)和圓錐體的繪圖(cone plot)(patches)。不管如何,您可以獨立的設定〔每一個打光(lighting)〕的特徵(characteristics)。
camlight、lighting)。AmbientStrength屬性的值來改進暗藍色(dark blue)的可見度(visibility)。(注意:你也可以明確說明不同的colormap來改變切片平面(slice planes)的上色(coloring)。)DiffuseStrength的屬性值可以特別的加亮(brighten)那些圓錐體,而不會顯現鏡面反射(specular reflections)。camlight right; lighting phong set(hsurfaces,'AmbientStrength',.6) set(hcones,'DiffuseStrength',.8)
See Also
isosurface, patch, reducevolume, smooth3, streamline, stream2, stream3, subvolume
| | condest | conj | |