
| MATLAB Function Reference |   |
Syntax
ZI = griddata(x,y,z,XI,YI)
[XI,YI,ZI] = griddata(x,y,z,xi,yi)
[...] = griddata(...,method)
Description
ZI = griddata(x,y,z,XI,YI)
使(通常是)不一致的空間向量 (x,y,z) 中的資料對應到一個符合 z = f(x,y) 形式的表面上。griddata 用由 (XI,YI) 定義的點修改表面來產生 ZI。這個表面總是會經過資料點。XI 和 YI 通常形成均勻的格子。(如同 meshgrid 所產生的)。
XI 可以是一個橫列向量,在這個情形下,它定義一個直行元素是常數的矩陣。相同的,YI 可以是一個直行向量,它定義一個橫列元素是常數的矩陣。
[XI,YI,ZI] = griddata(x,y,z,xi,yi)
同上,傳回修改過的矩陣 ZI,且傳回從橫列向量 xi 和直行向量 yi 形成的矩陣 XI 和 YI。後者與 meshgrid 傳回的矩陣相同。
[...] = griddata(..., 使用特定的修改方法:method)
'linear' |
Triangle-based linear interpolation (預設) |
'cubic' |
Triangle-based cubic interpolation |
'nearest' |
Nearest neighbor interpolation |
'v4' |
MATLAB 4 griddata 方法 |
method 定義欲符合資料的表面種類。'cubic' 和 'v4' 方法產生平滑的表面,而 'linear' 和 'nearest' 分別在第一個和第零個導數是不連續的。除了 'v4' 之外的其他方法都是以資料的 Delaunay 三角測量(triangulation)為基礎。
Remarks
XI 和 YI 可以是矩陣,在這種情形下 griddata 傳回對應 (XI(i,j),YI(i,j)) 的值。或是,你可以分別傳橫列和直行向量 xi 和 yi。在這種情形下,griddata 把這些向量當作他們是由 meshgrid(xi,yi) 指令產生的矩陣。
Algorithm
griddata(...,'v4')指令使用[1]中敘述的方法。其他方法以 Delaunay 三角測量(triangulation)(see delaunay)為基礎。
Examples
rand('seed',0)
x = rand(100,1)*4-2; y = rand(100,1)*4-2;
z = x.*exp(-x.^2-y.^2);
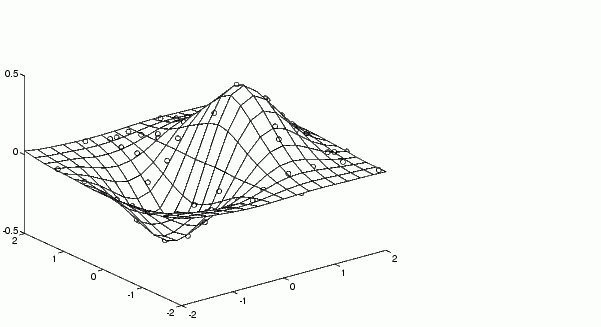
x,y 和 z 現在是包含不一致樣本資料的向量。定義一個一般的格子,然後將資料對應到格子中:
ti=-2:.25:2;[XI,YI]=meshgrid(ti,ti);ZI=griddata(x,y,z,XI,YI);
mesh(XI,YI,ZI), holdplot3(x,y,z,'o'), holdoff

See Also
delaunay, griddata3, griddatan, interp2, meshgrid
References
[1] Sandwell, David T., "Biharmonic Spline Interpolation of GEOS-3 and SEASAT Altimeter Data", Geophysical Research Letters, 2, 139-142,1987.
[2] Watson, David E., Contouring: A Guide to the Analysis and Display of Spatial Data, Tarrytown, NY: Pergamon (Elsevier Science, Inc.): 1992.
 | grid | griddata3 |  |