- (*)About k-means clustering:
Given a set of $n$ points in a $d$-dim space $\mathbf{X}=\{\mathbf{x}_1, \mathbf{x}_2, \dots, \mathbf{x}_n\}$, we want to find another set of $m$ points in the same space $\mathbf{C}=\{\mathbf{c}_1, \mathbf{c}_2, \dots, \mathbf{c}_m\}$, with $m \lt \lt n$.
- What is the goal of k-means clustering?
- Define the objective function of k-means clustering. (Please explain your math notations in detail.)
- Describe how the objective function can be minimized in a step-by-step manner.
- Why the objective function is guaranteed to be non-increasing during the iterations?
- (*)K-means clustering for image data compression: Please explain briefly how k-means clustering can be used for image data compression.
- (*)Some identities for k-means clustering:
Here are some identities for k-means and k-medians clustering.
- Given a vector $\mathbf{x}=[x_1, x_2, \dots, x_n]$, prove that $\arg \min_s \sum_{i=1}^n (s-x_i)^2 = mean(\mathbf{x})$.
- Given a vector $\mathbf{x}=[x_1, x_2, \dots, x_n]$, prove that $\arg \min_s \sum_{i=1}^n |s-x_i| = median(\mathbf{x})$.
- Given a set of vectors $\mathbf{X}=[\mathbf{x}_1, \mathbf{x}_2, \dots, \mathbf{x}_n]$, prove that $\arg \min_\mathbf{s} \sum_{i=1}^n \|\mathbf{s}-\mathbf{x}_i\|_2^2 = mean(\mathbf{X}, 2)$.
- Given a set of vectors $\mathbf{X}=[\mathbf{x}_1, \mathbf{x}_2, \dots, \mathbf{x}_n]$, prove that $\arg \min_\mathbf{s} \sum_{i=1}^n \|\mathbf{s}-\mathbf{x}_i\|_1 = median(\mathbf{X}, 2)$.
- (*)
Objective function w.r.t. the number of clusters:
Write a script that obtains the dataset via the following statement:
DS = dcData(5); Then use kMeansClustering.m for k-means clustering, according to the following criterion.- Let the number of clusters start from 1 to 10 and plot the objective function. The plot should be similar to the one shown next:
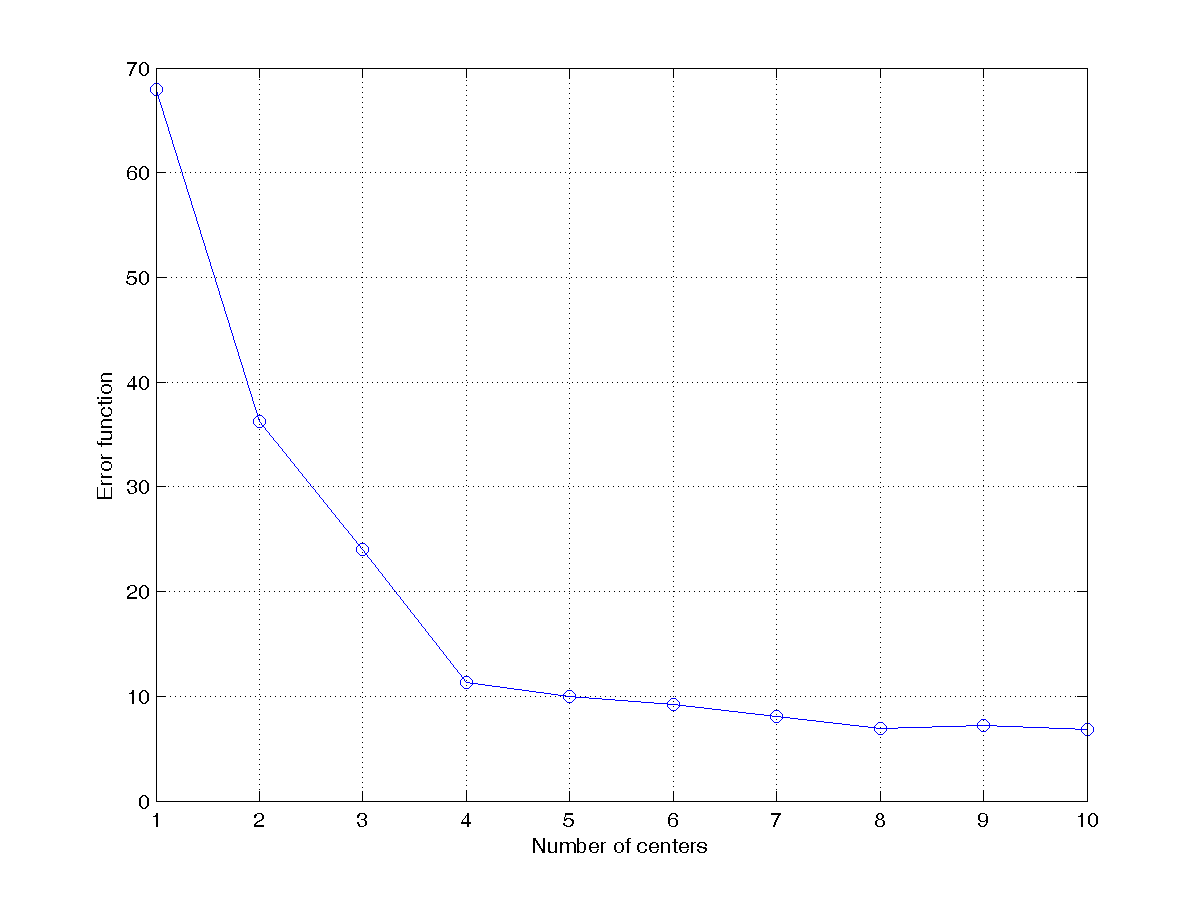
- From the scatter plot of the data set (see this example), we know the best number of clusters is 4 by visual inspection. Can you think of a reliable way to determine the best number of clusters automatically? Please implement your method in the script and print out the best number of clusters directly. This is your first attemp at cluster validation which uses a certain criterion to determine the best number of clusters automatically.
- To see how your method for cluster validation works, try the following datasets:
- DS = dcData(1);
- DS = dcData(3);
- DS = dcData(4);
- DS = dcData(6);
- Let the number of clusters start from 1 to 10 and plot the objective function. The plot should be similar to the one shown next:
- (**)
Selection of the initial centers:
Please modify the first two lines of this example as follows:
DS = dcData(1); centerNum=6; After running the script several times, you will notice that the initial centers play an important roles in determining the final clustering result. Since kMeansClustering.m can also take a set of initial centers for clustering, your task is to write an m-file function myVqInitCenter.m that can return a set of centers for better clustering for k-means, with the same usage as vqInitCenter.m. As described in the text, some of the methods include:- Randomly select k data points from the dataset.
- Select the farthest k data points from the mean of the dataset.
- Select the nearest k data points from the mean of the dataset.
- Select k data points that have the largest sum of pairwise square distance.
- Find two points that has the maximal square distance among all data set. Put these two data set in the pool of centers.
- Add a new points to the pool that can increase the sum of square distance most.
- Repeat the previous step until we have k centers.
centerNum=6; runNum=20; dist1=zeros(runNum,1); dist2=zeros(runNum,1); % ====== Get initial cluster centers for i=1:runNum DS = dcData(1); initCenter=vqInitCenter(DS.input, centerNum, 1); [center, U, distortion, allCenters] = kMeansClustering(DS.input, initCenter); dist1(i)=distortion(end); initCenter=myVqInitCenter(DS.input, centerNum); [center, U, distortion, allCenters] = kMeansClustering(DS.input, initCenter); dist2(i)=distortion(end); end plot(1:runNum, dist1, 'o-', 1:runNum, dist2, 'o-'); xlabel('Run index'); ylabel('Distortion'); legend('vqInitCenter', 'myVqInitCenter'); Your plot should be similar to the one shown next: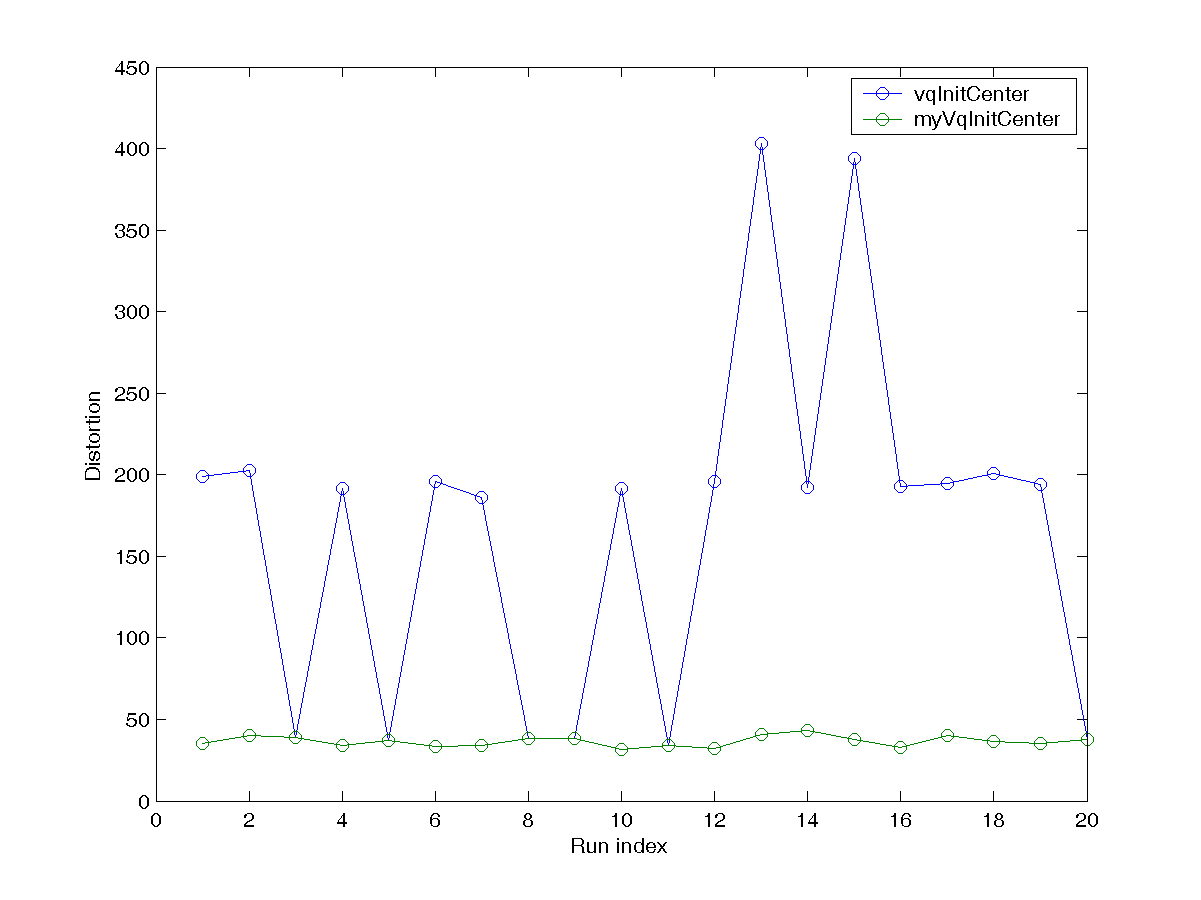
- distSqrPairwise.m (in Machine Learning Toolbox): Compute the pairwise square distance between any two points in a dataset.
- maxxy.m (in Utility Toolbox): Find the maximal element in a 2D matrix.
- (*)
Image compression ratio achieved by k-means clustering:
If we use 256 colors to represent an indexed-color image of m by n, what is the compression ratios of the following cases when compared with a true-color image of the same size?
- Use pixels for k-means clustering.
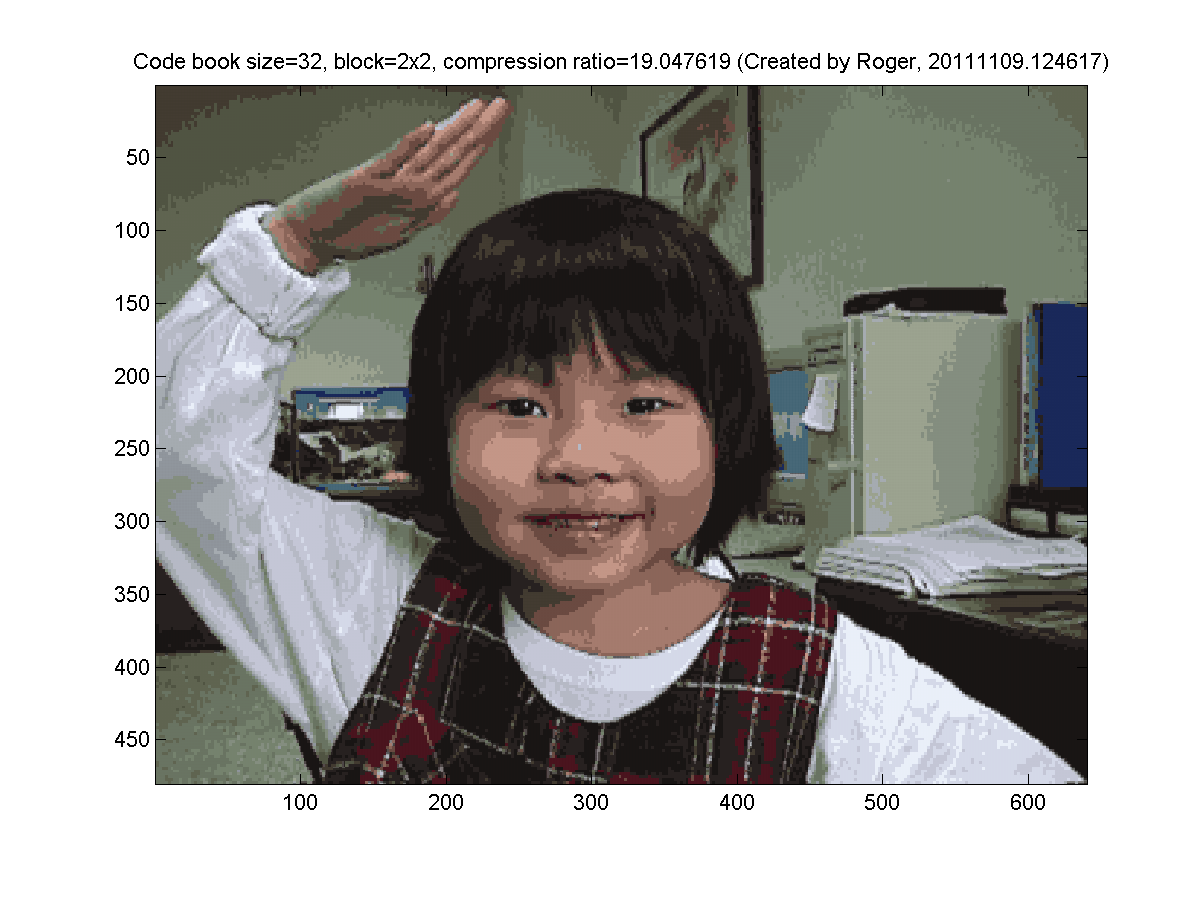
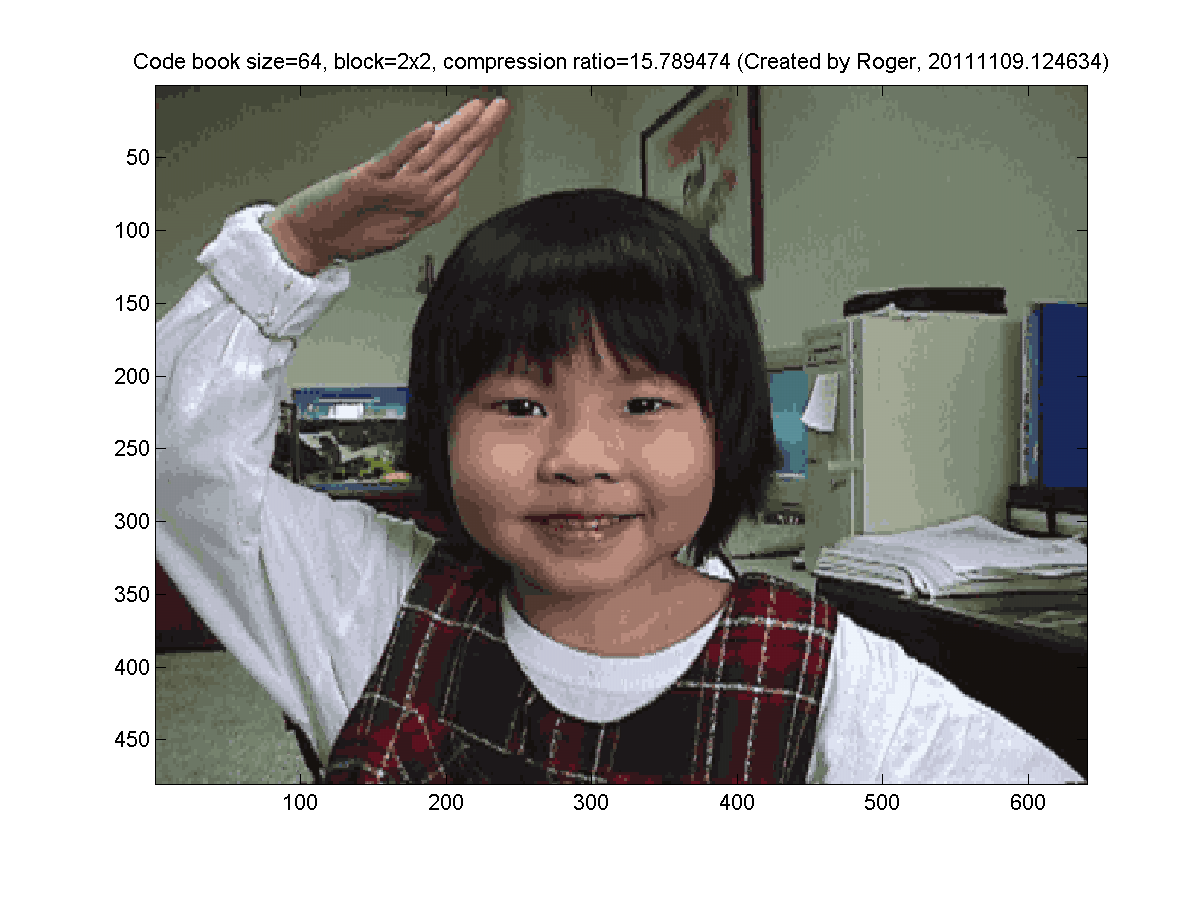
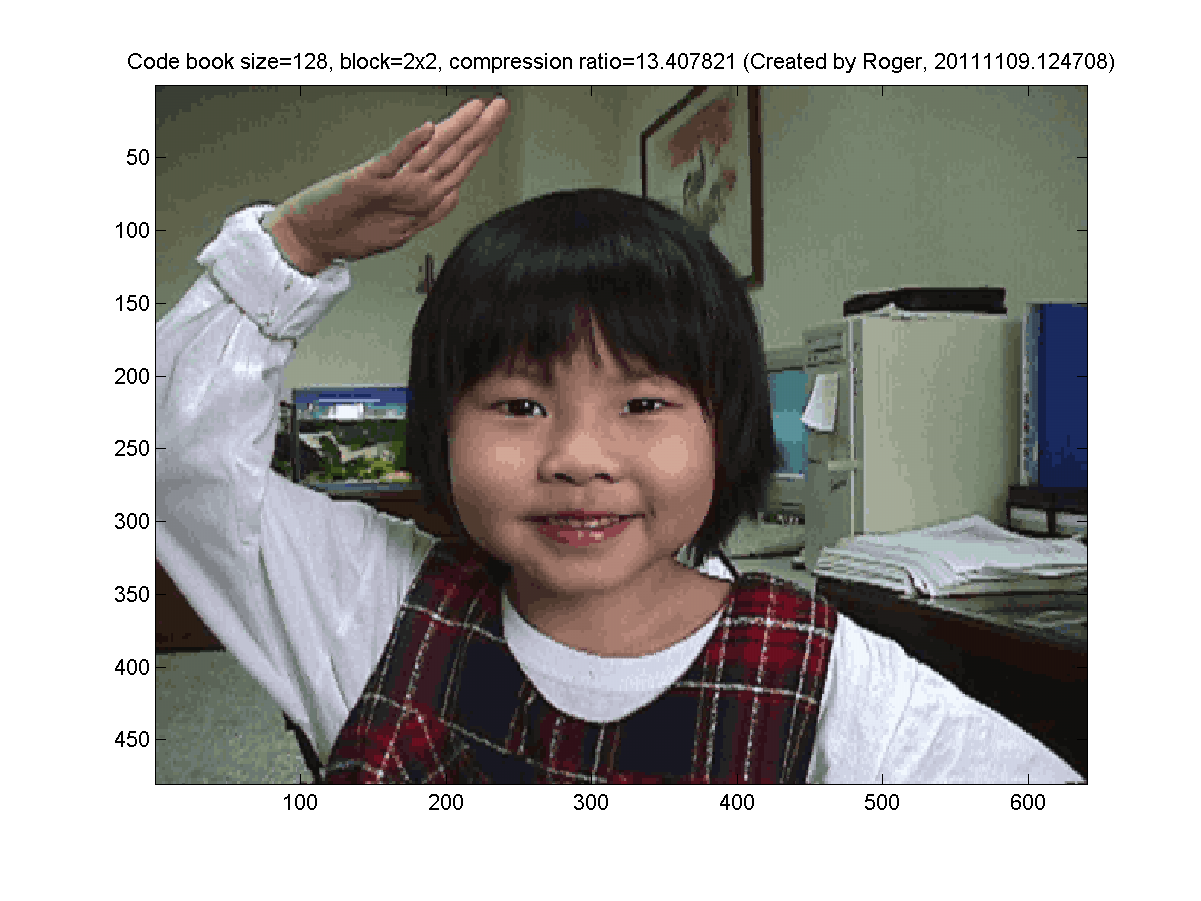
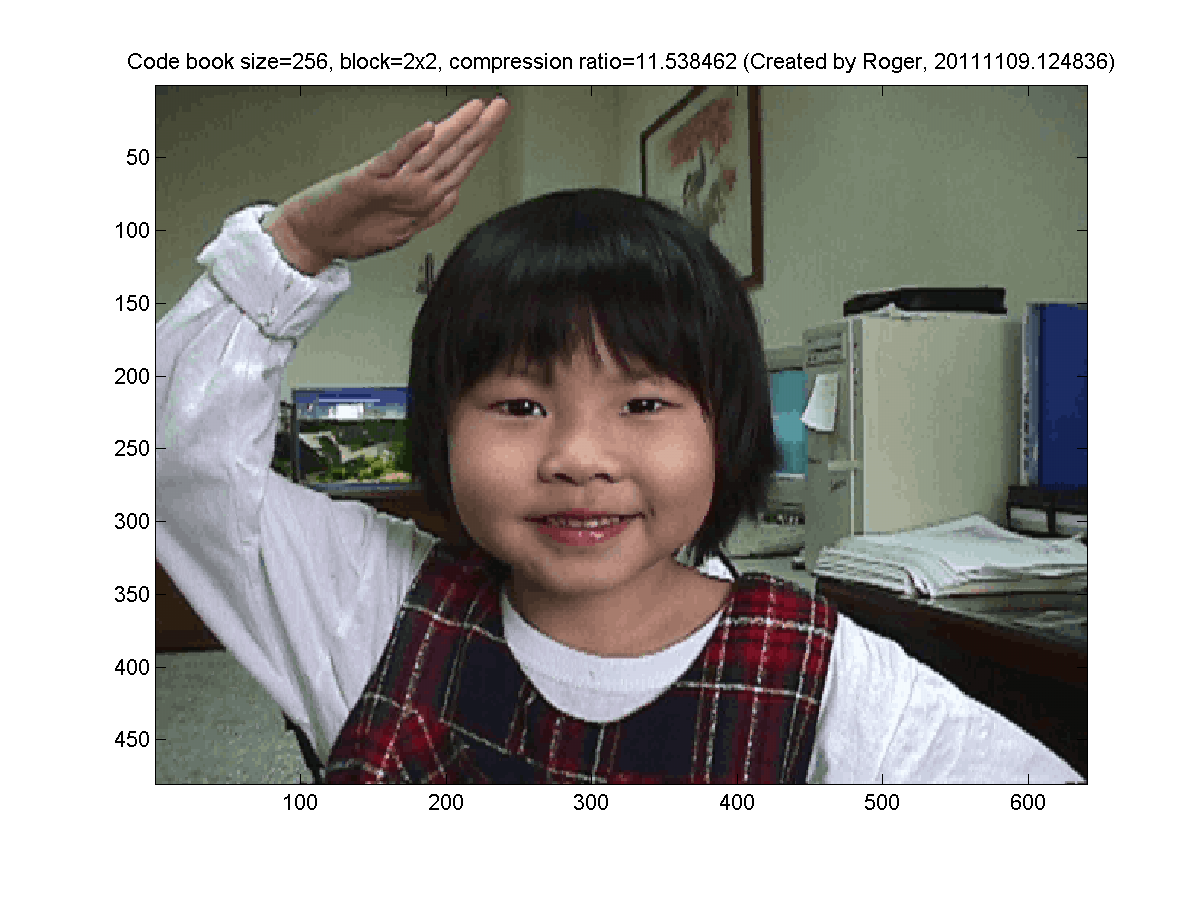
- Use 2x2 blocks for k-means clustering.
- Use 4x4 blocks for k-means clustering.
- Use qxq blocks for k-means clustering, assuming q is a factor of both m and n.
- (***)
Use k-means clustering on pixels of images for image compression:
A true-color image of size mxn is represented by mxn pixels, each consists of 24 bits of RGB colors. On the other hand, each pixel of an mxn index-color image is represented by an p-bit unsigned integer, which serves as an index into a color map of size 2^p by 3. In order to save storage space, we can use k-means clustering to convert a true-color image into an index-color image. The original true-color image requires 24*m*n bits of storage. After the conversion, the index-color image requires p*m*n+8*2^p*3 bits of storage. If we use 256 colors to represent an indexed image of 480*640, the compression ratio is (24*480*640)/(8*480*640+8*256*3) = 2.9925.
The goal of this exercise is to display the images after data compression using k-means clustering. The original true-color image is shown next:
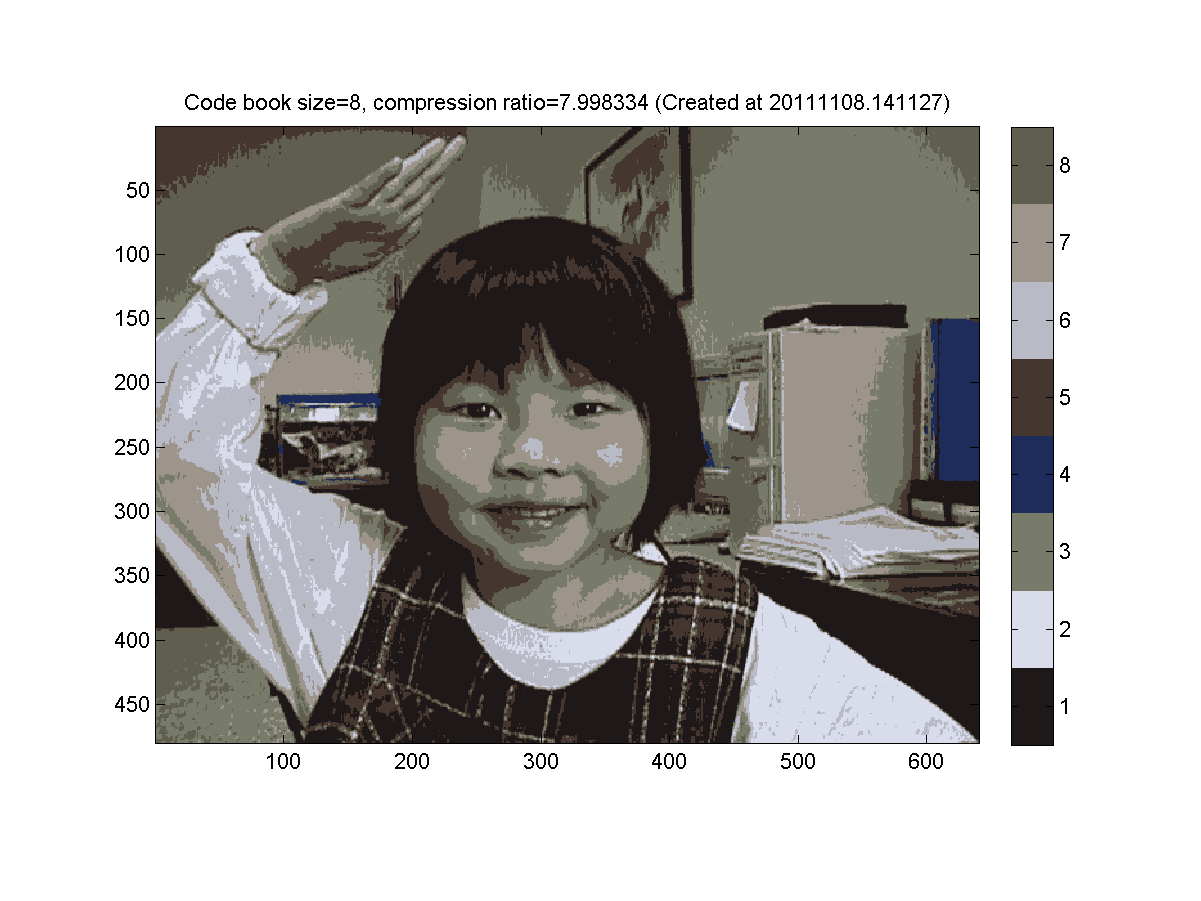
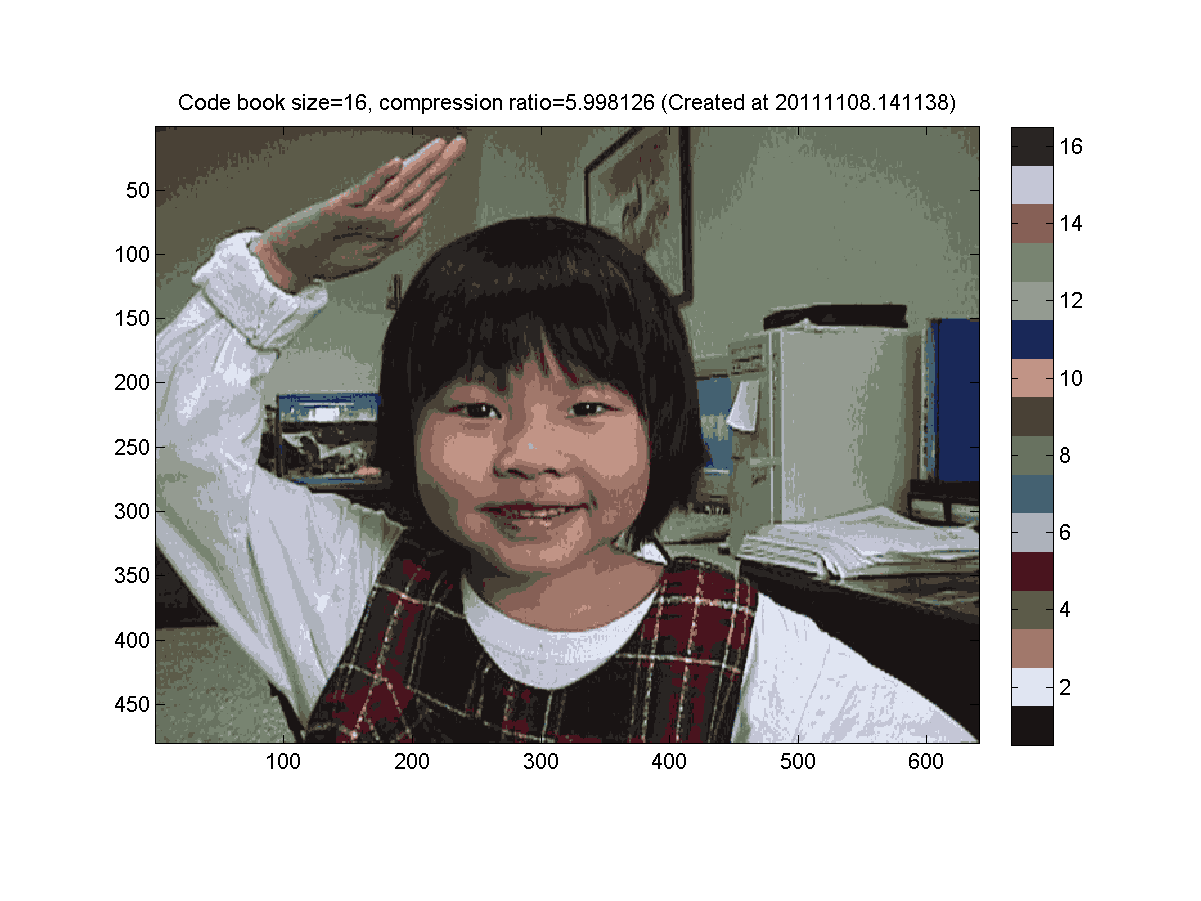
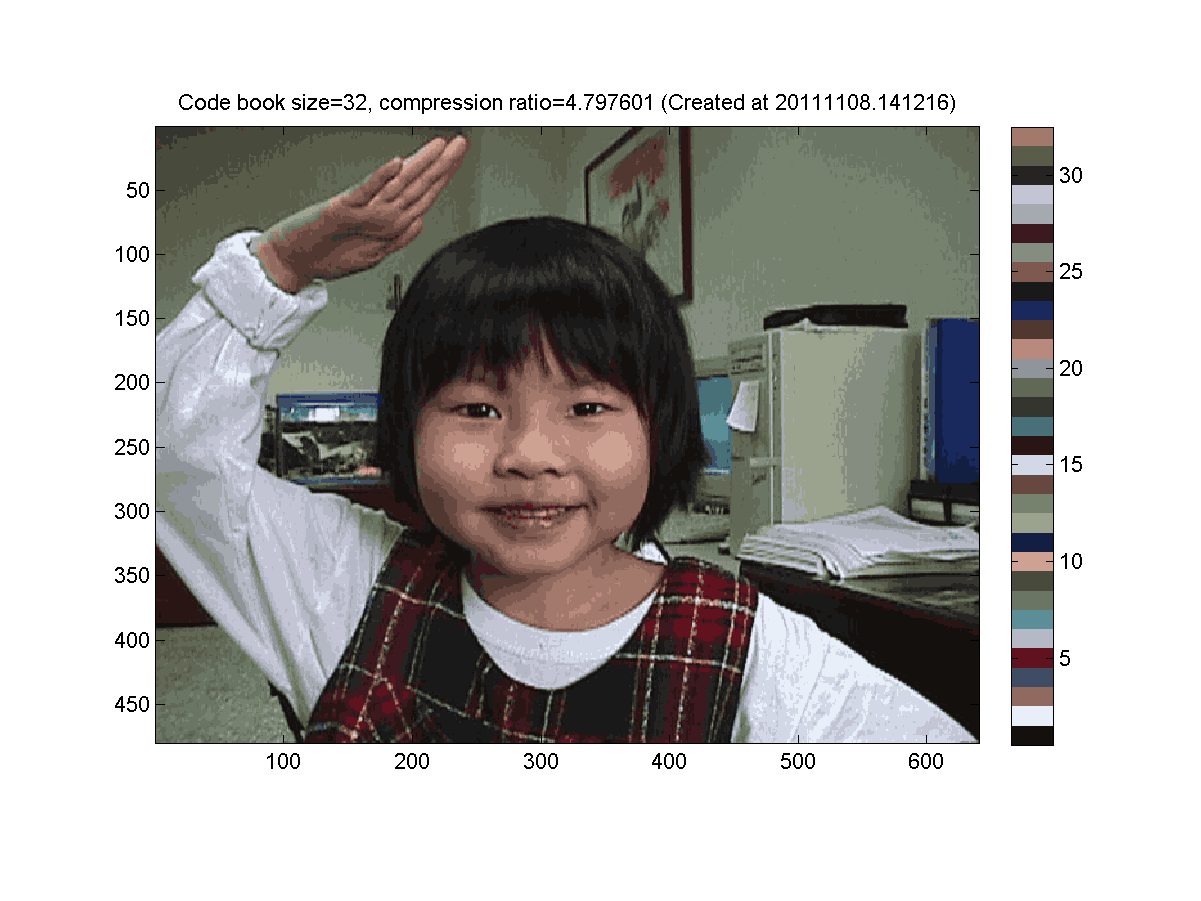
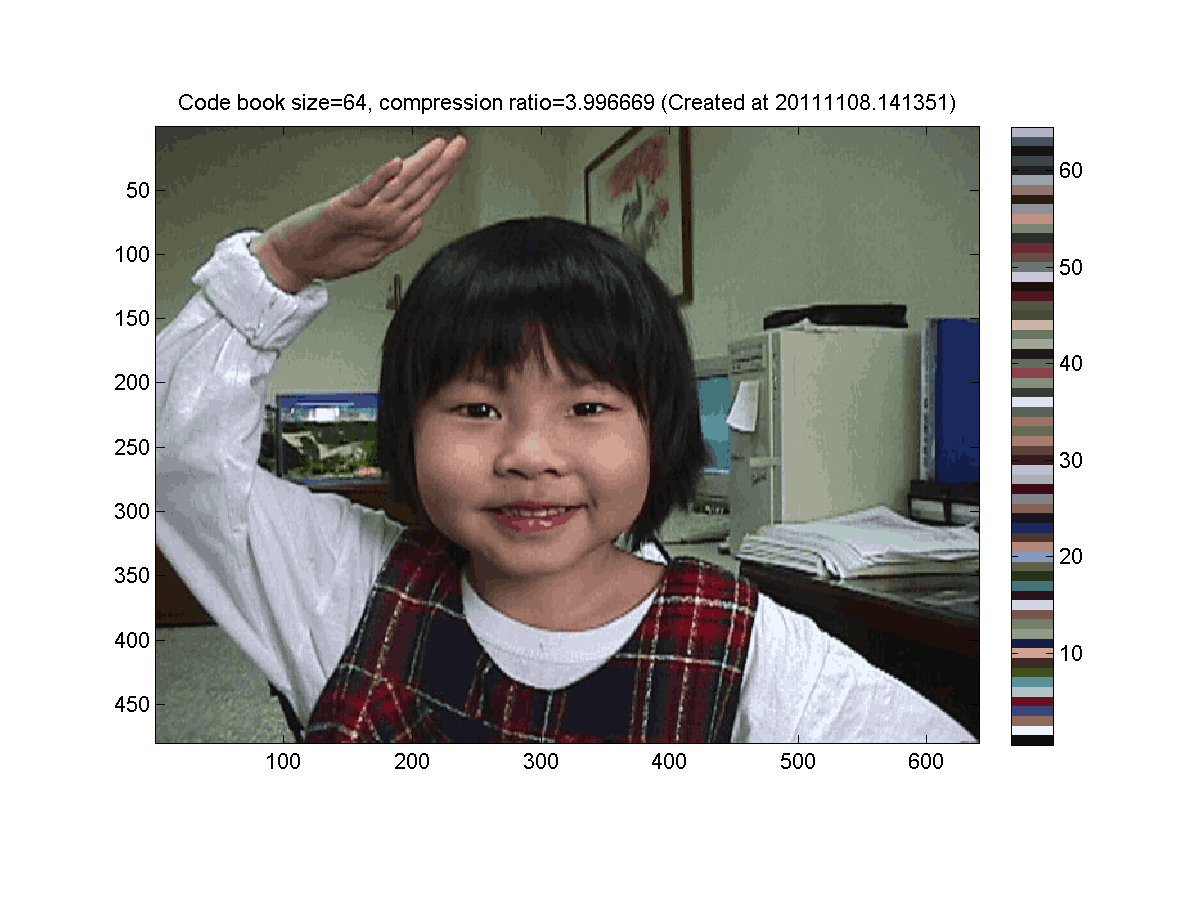
Your mission is to convert the original true-color image into an index-color one using k-means clustering on each pixel represented as a vector of 3 elements of RGB intensity. Let k take the values of 2, 4, 8, 16, 32, 64 and display the corresponding index-color images as shown next. How long does it take to run each k-means clustering? What are the distortion of each images? Hint:- You need to read the original image and convert it into a 3x307200 data matrix of "double", where each column is the RGB vector of an pixel.
- Use imread to read an image, image to display an image, and colorbar to display the color map.
- Use kMeansClustering for k-means clustering.
- Use distPairwise to find the distance between two sets of vectors.
- (***)
Use k-means clustering on blocks of images for image compression:
Repeat the previous exercise but use blocks of different sizes for k-means clustering.
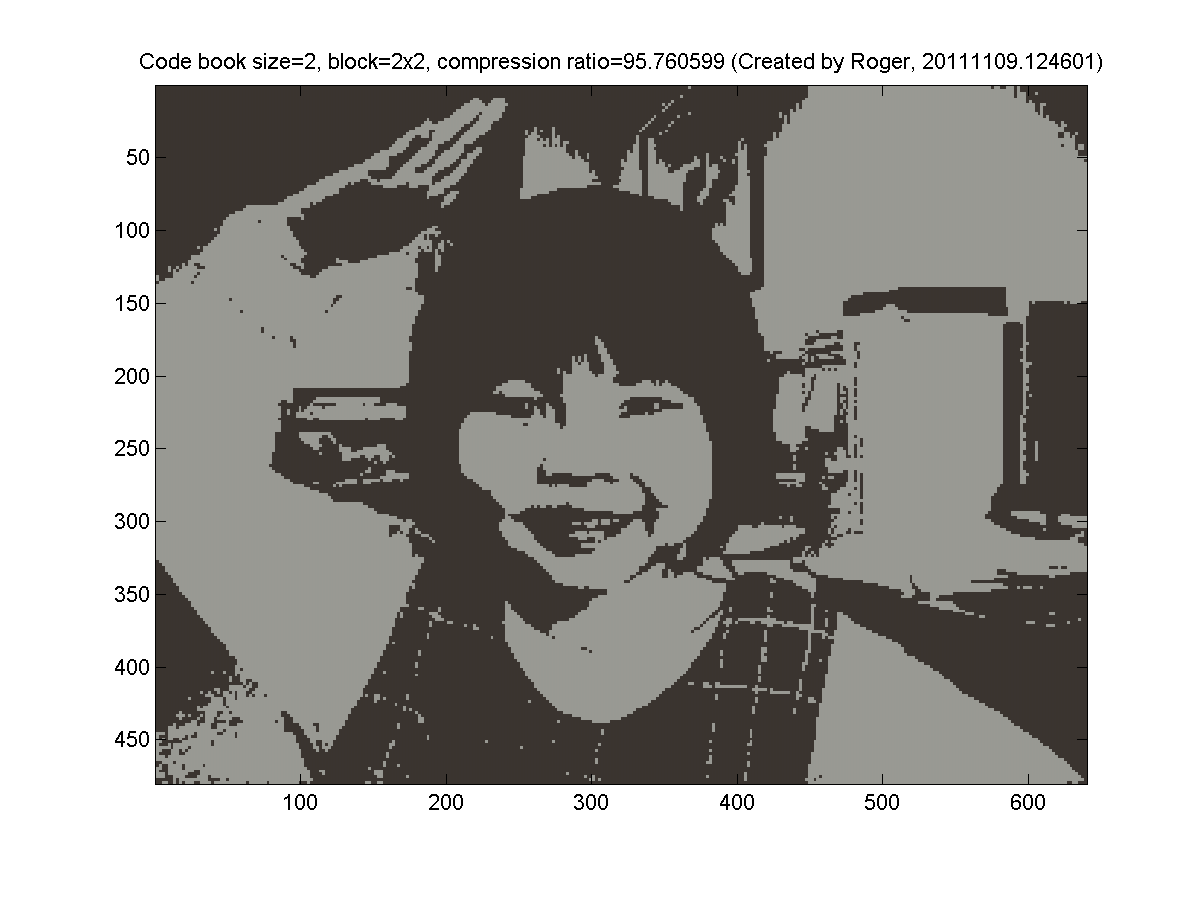
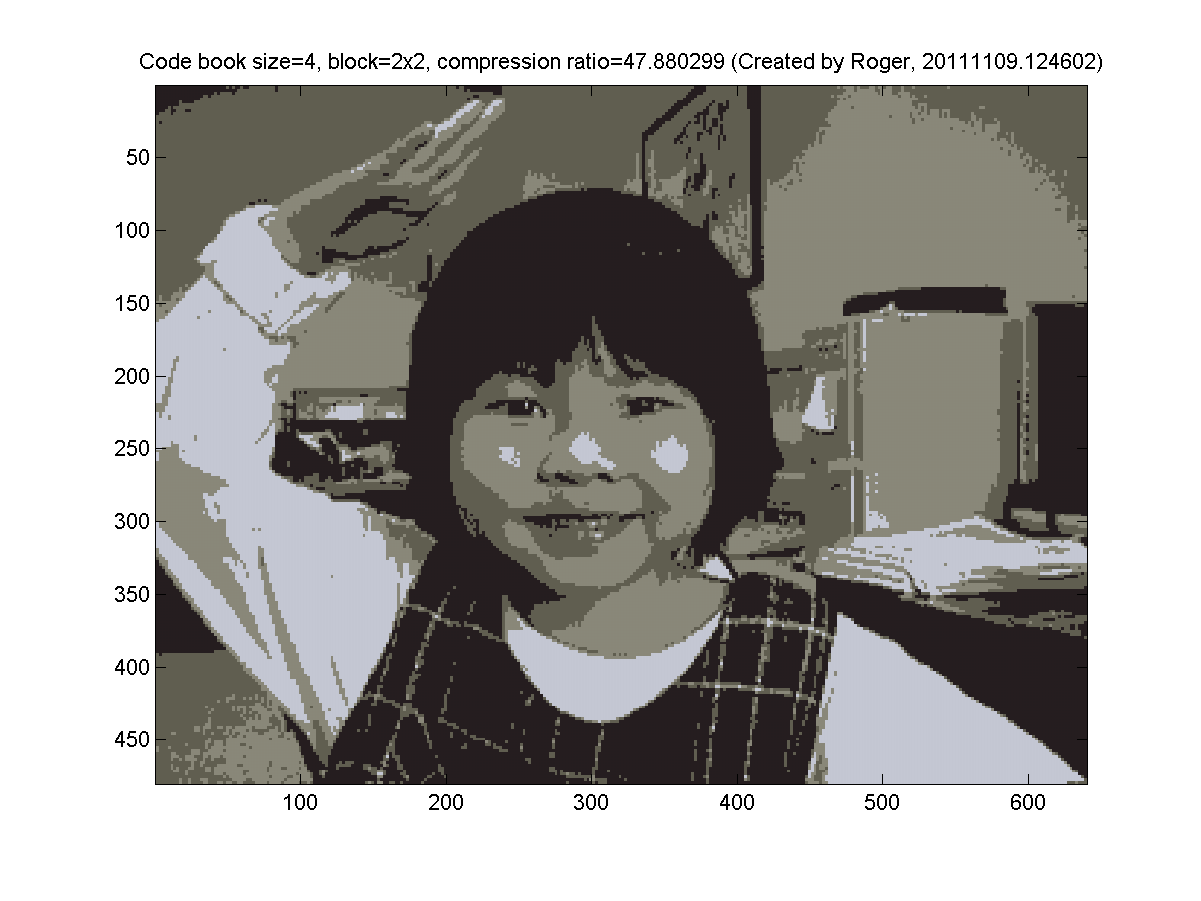
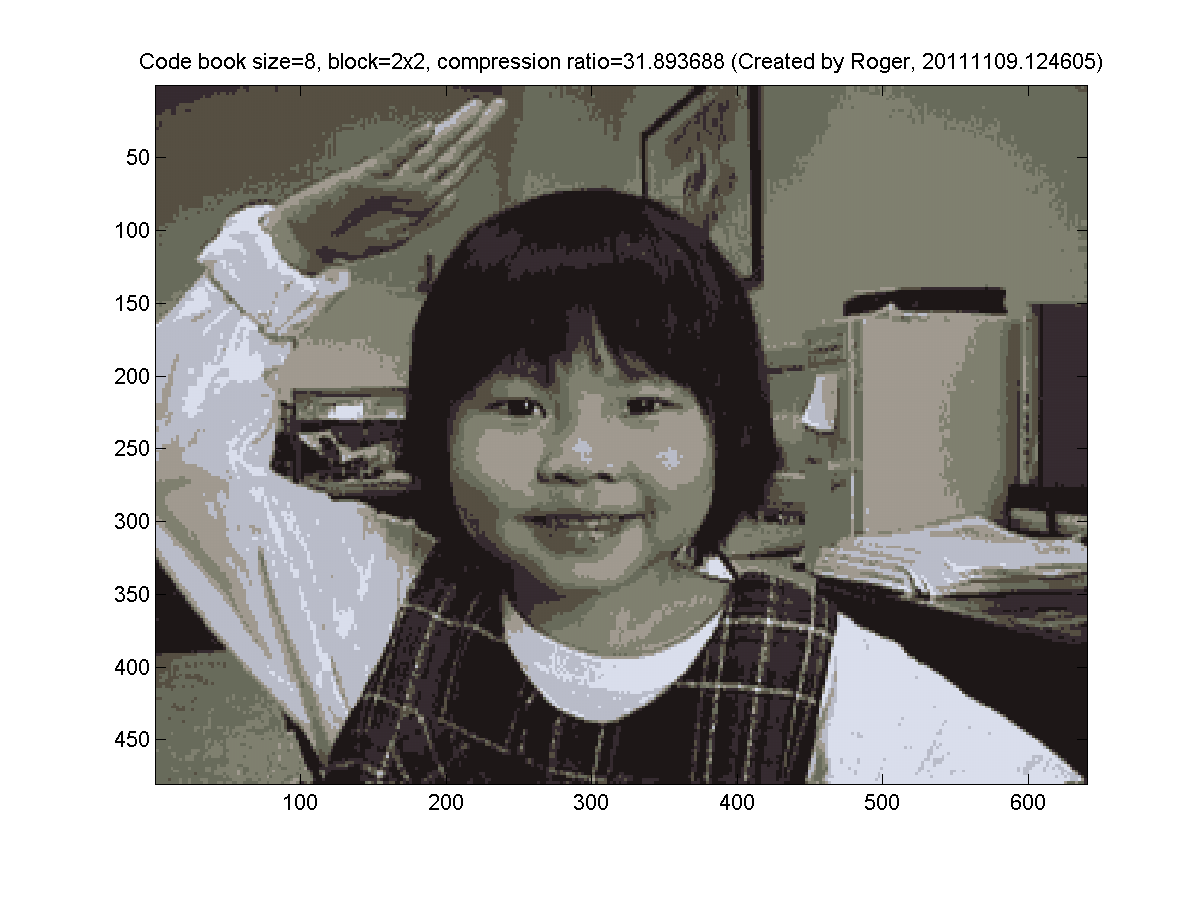
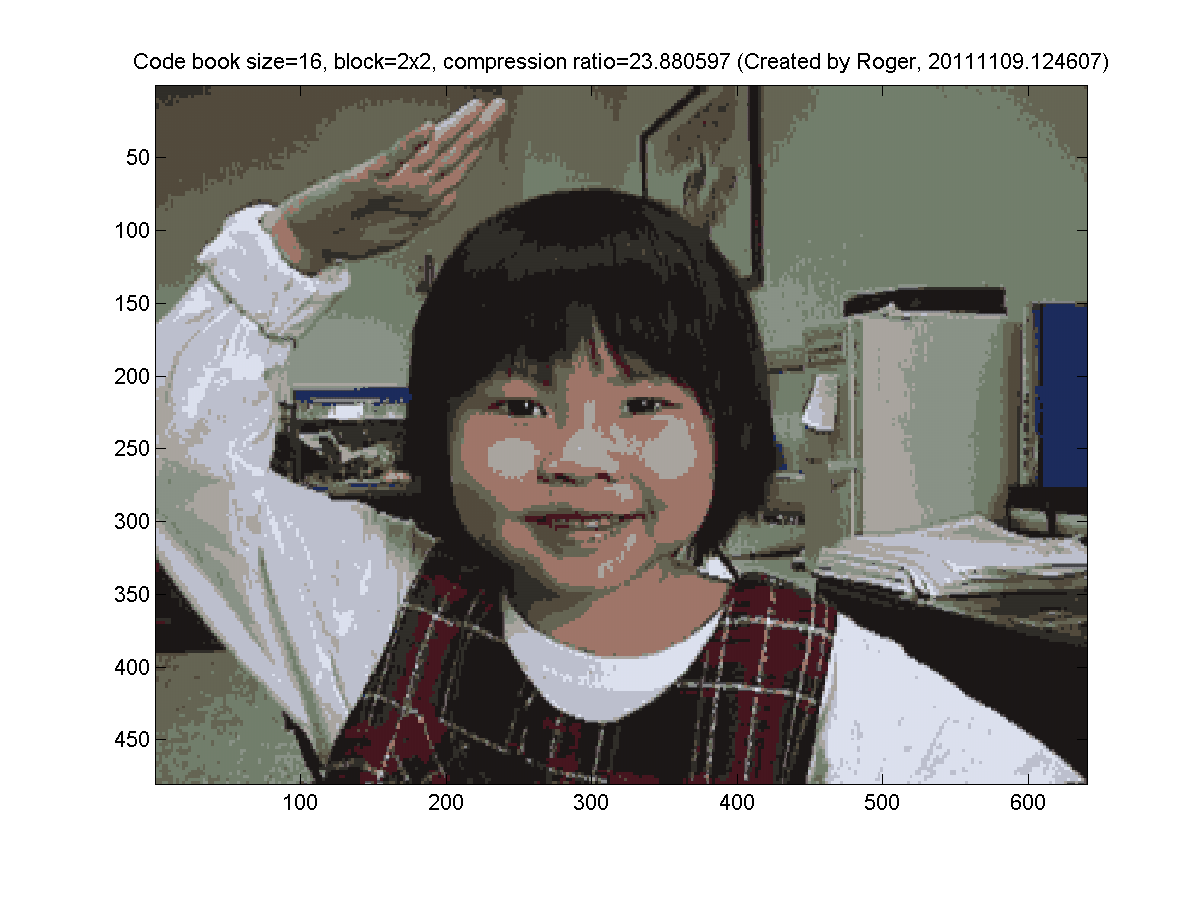
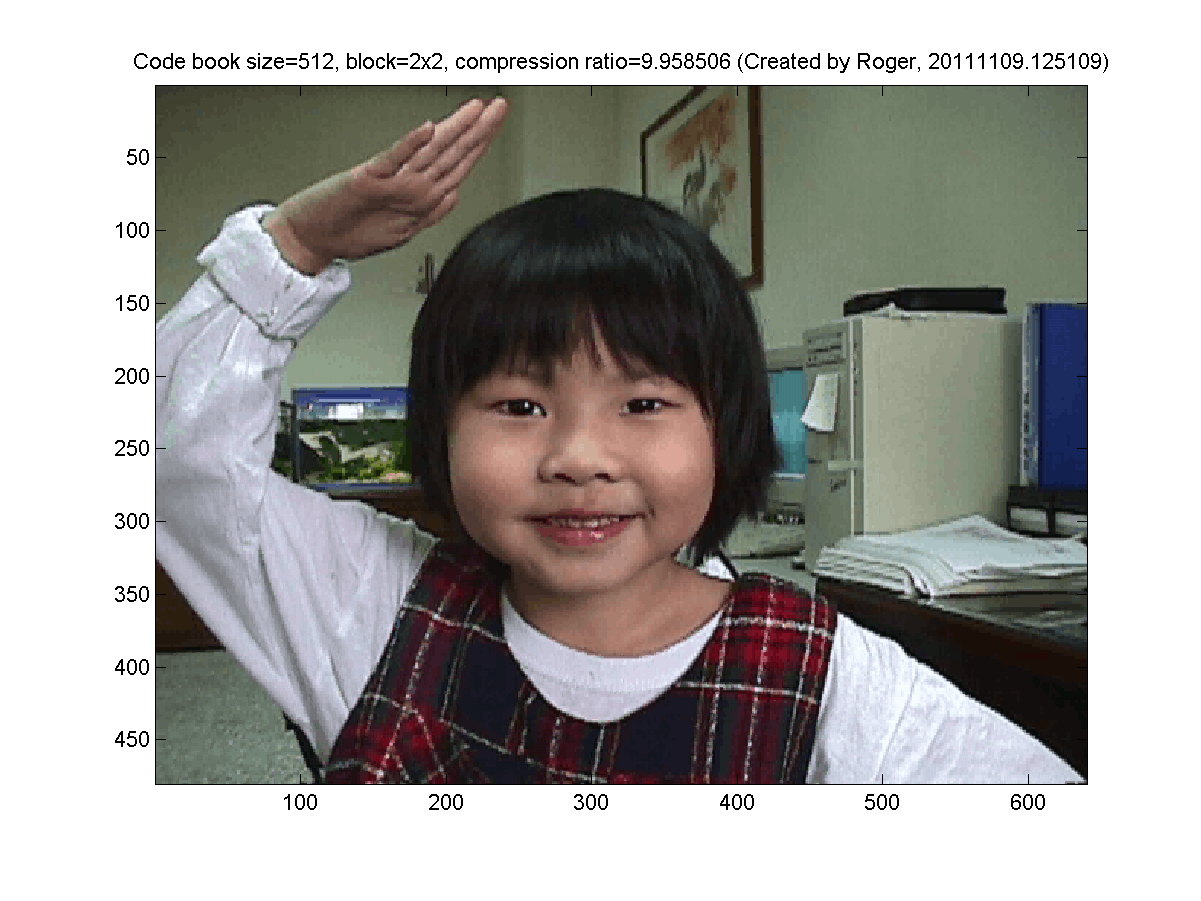
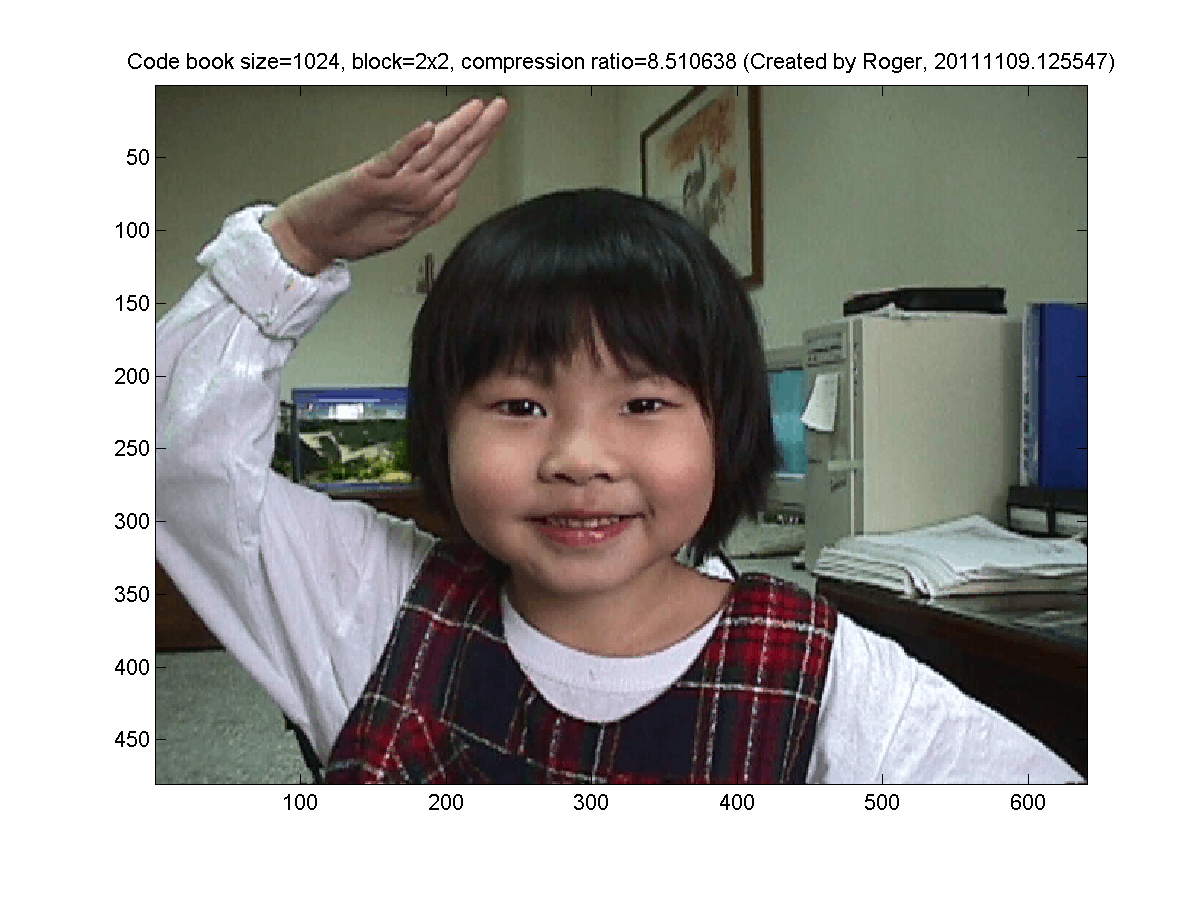
- 2x2 blocks (4 pixels, so the dimension is 3*4=12 for k-means clustering). My results are as follows:
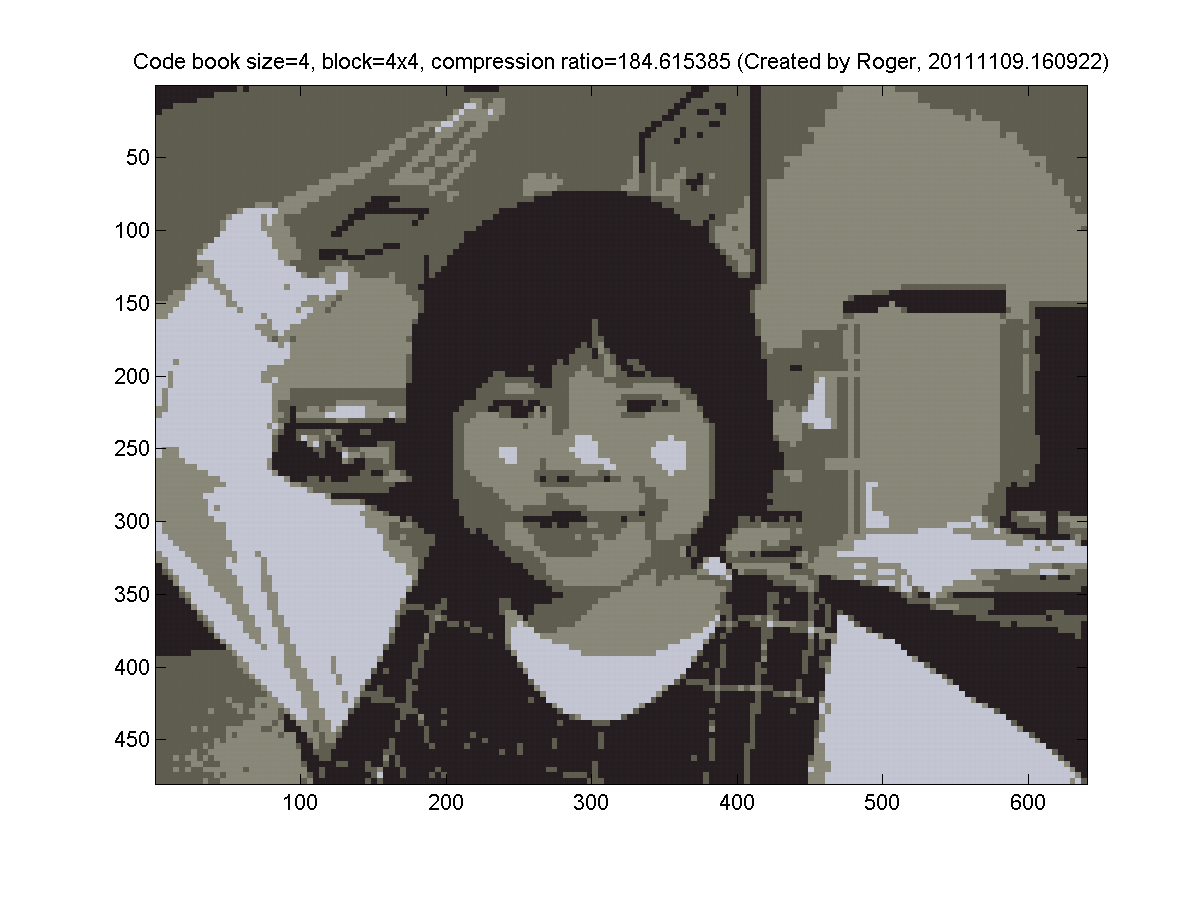
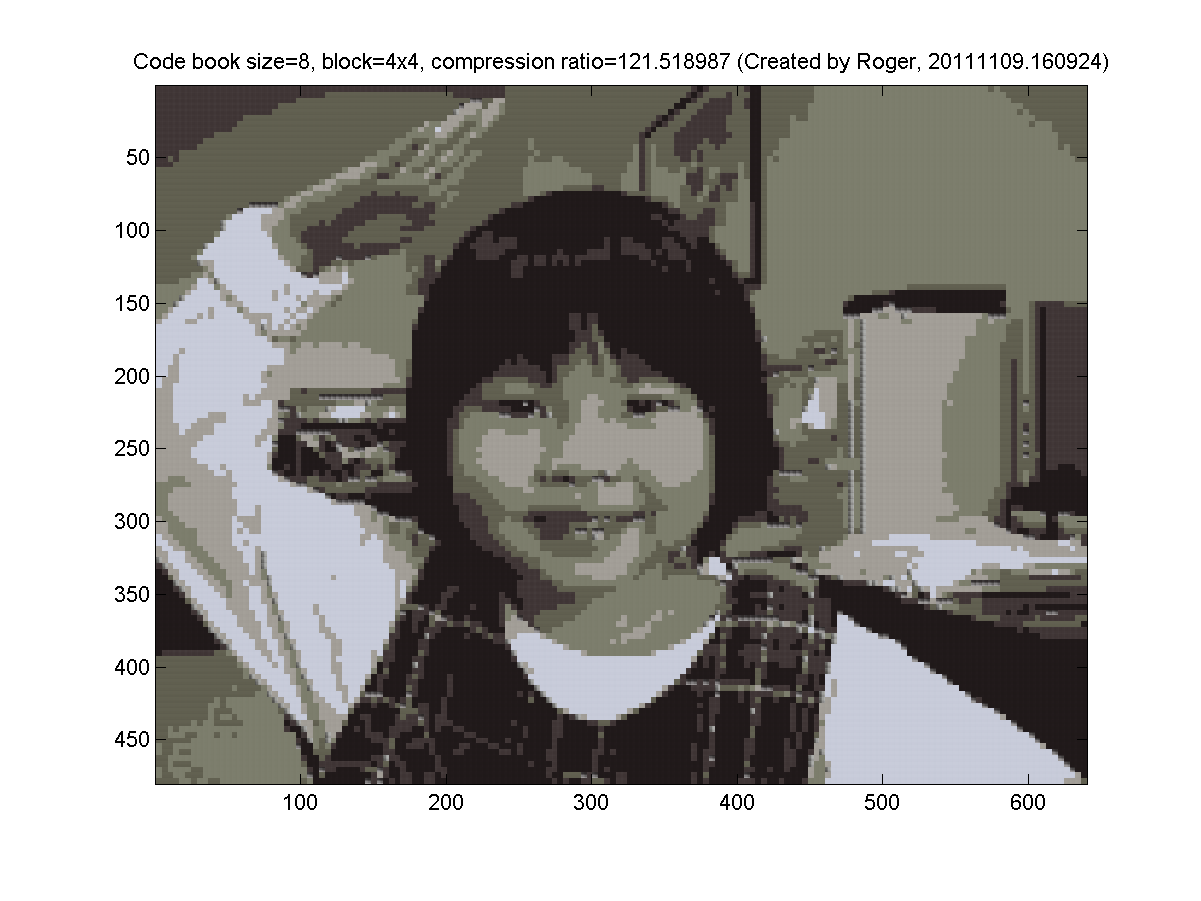
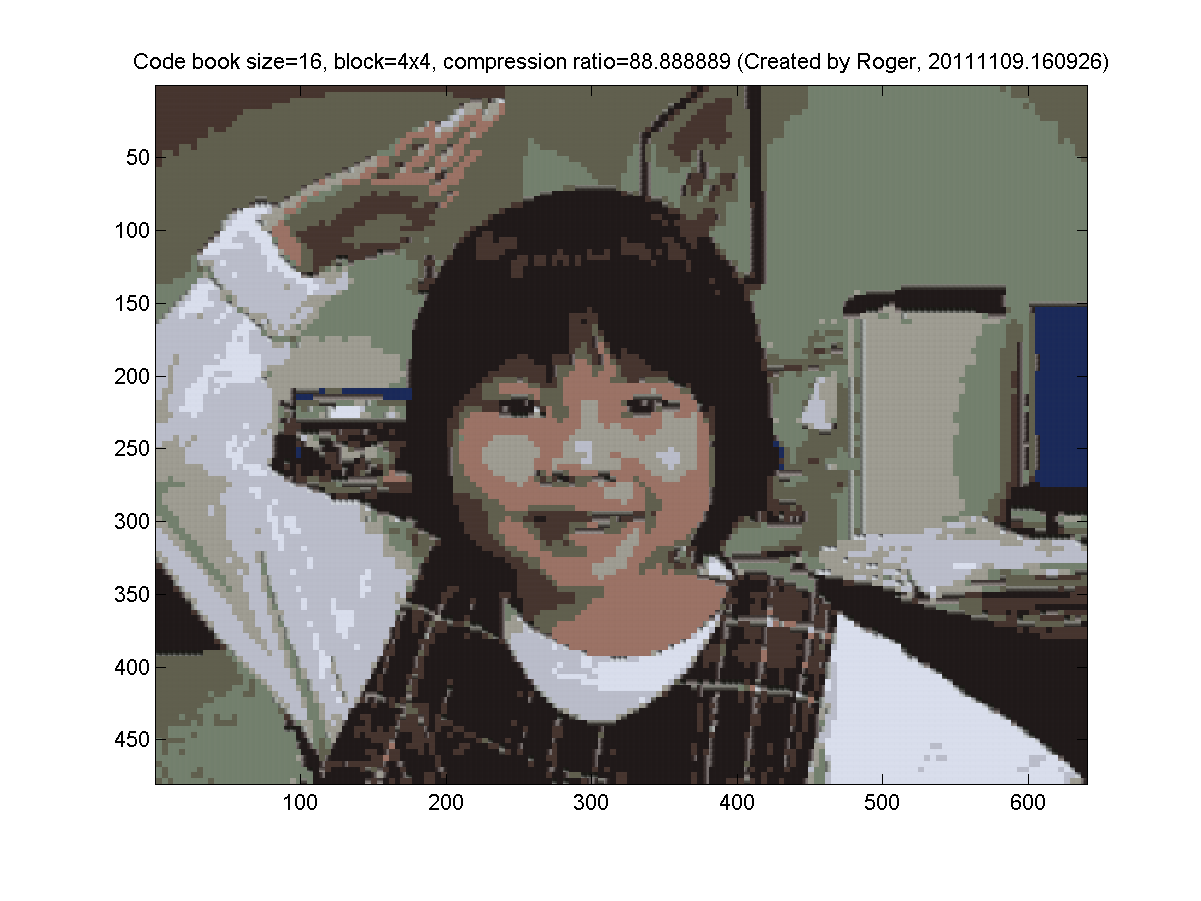
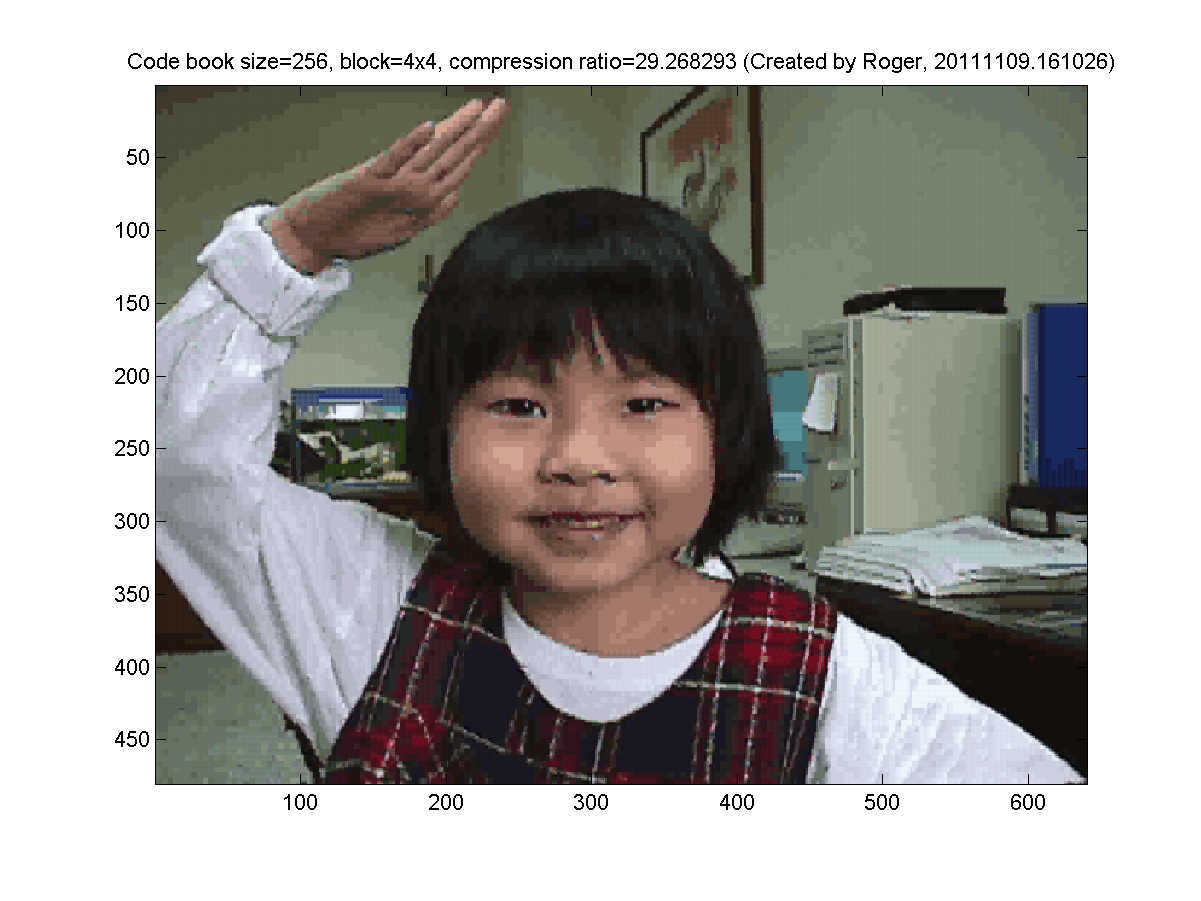
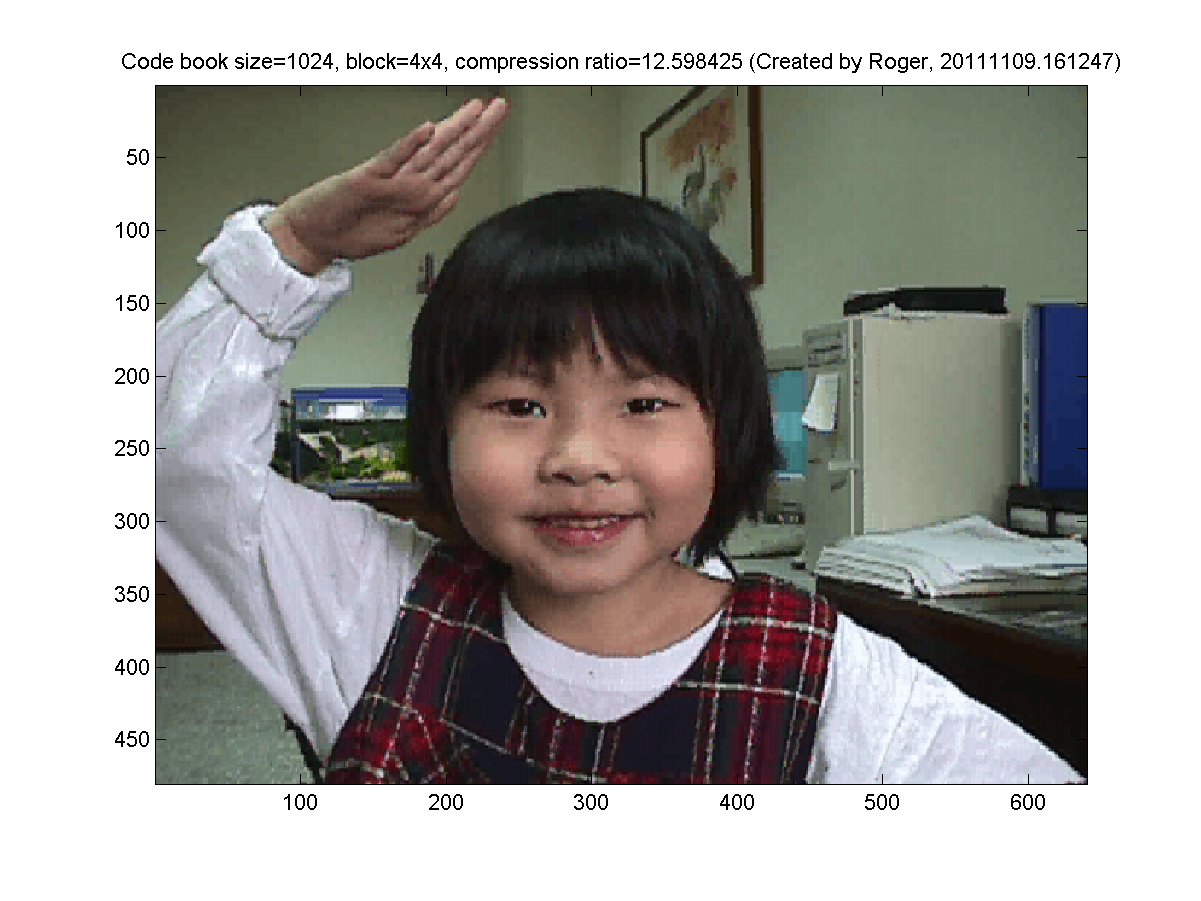
- 4x4 blocks (16 pixels, so the dimension is 3*16=48 for k-means clustering). My results are as follows:
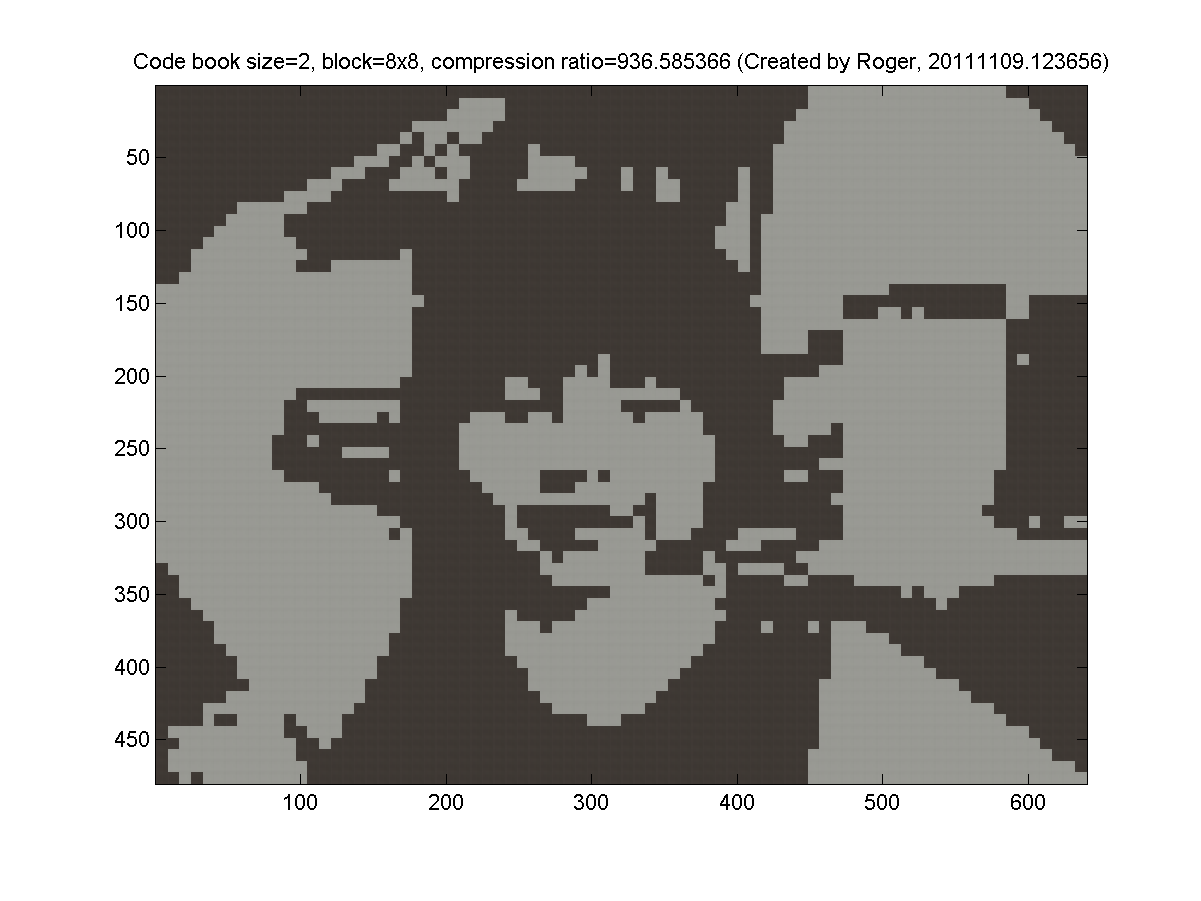
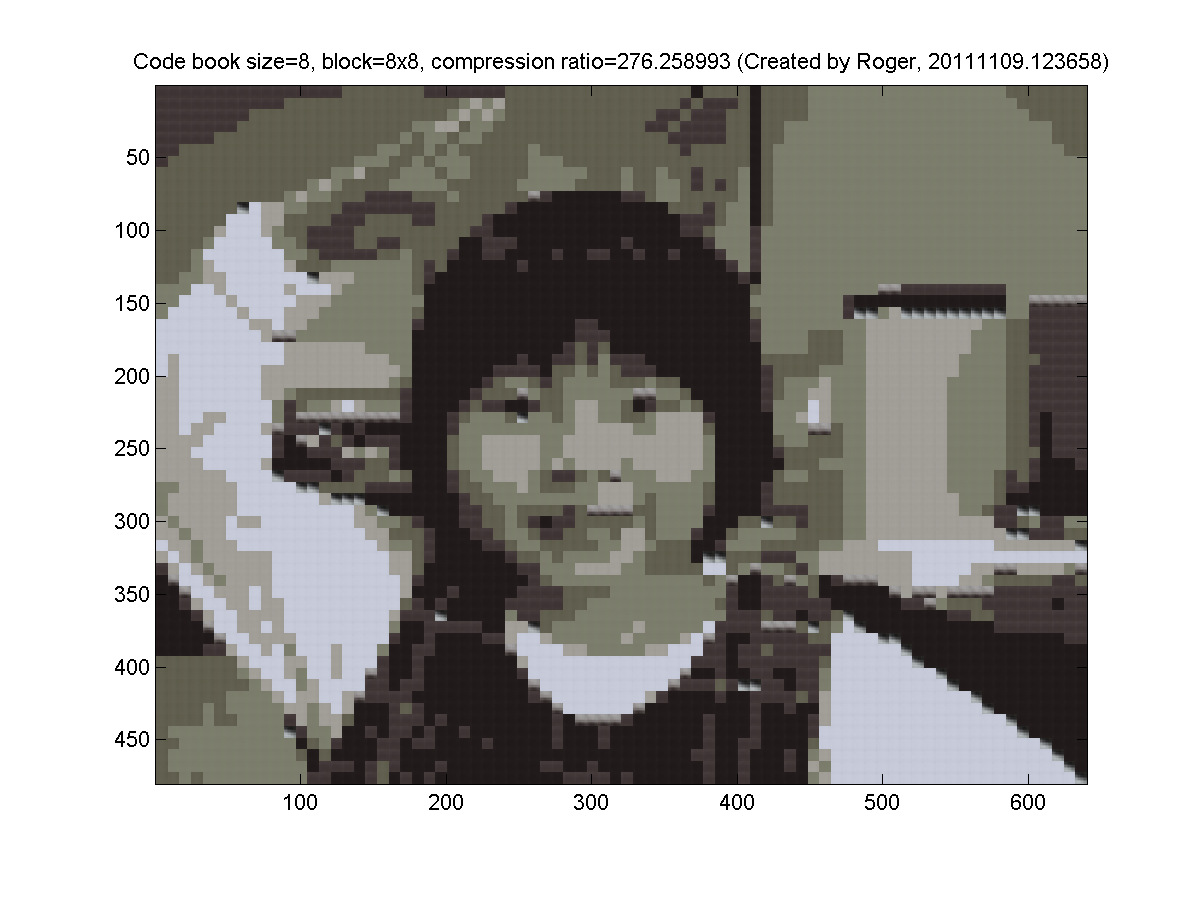
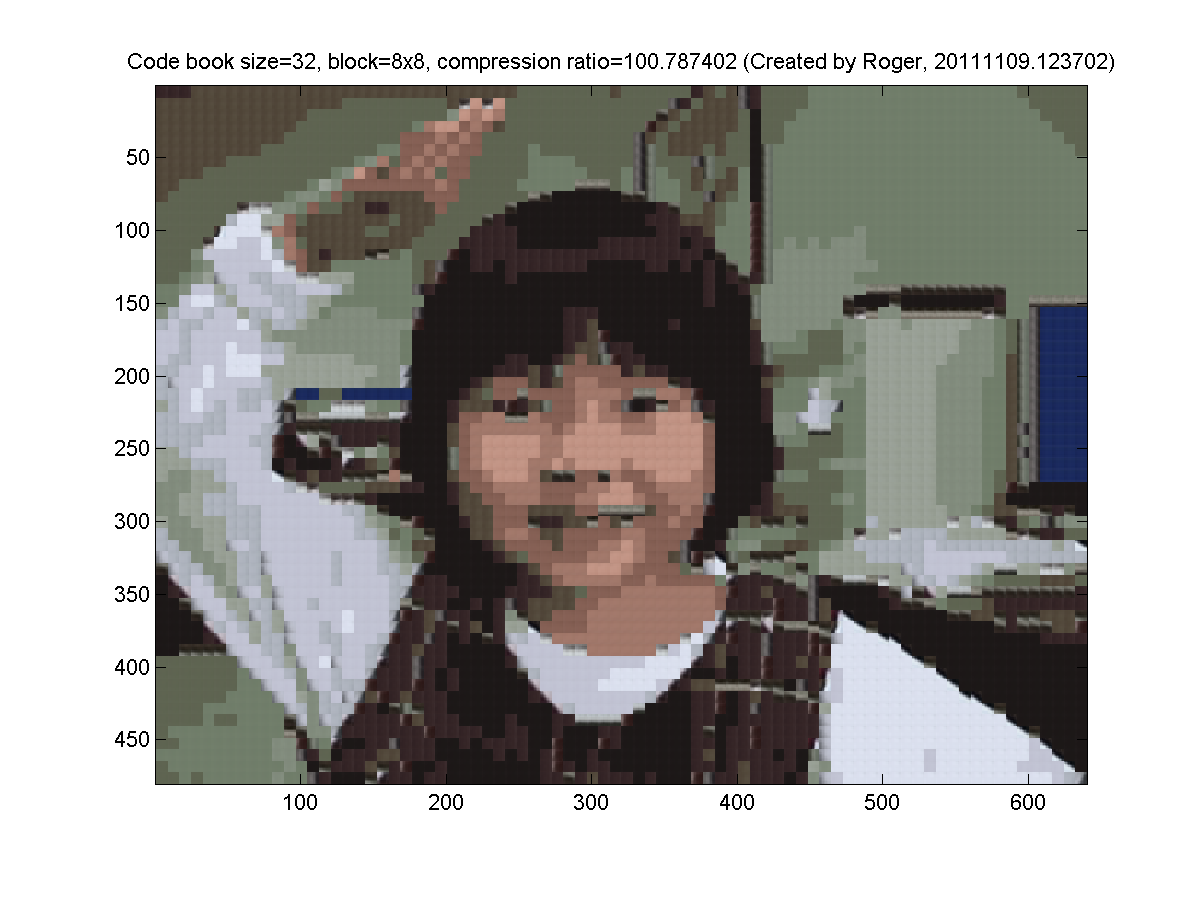
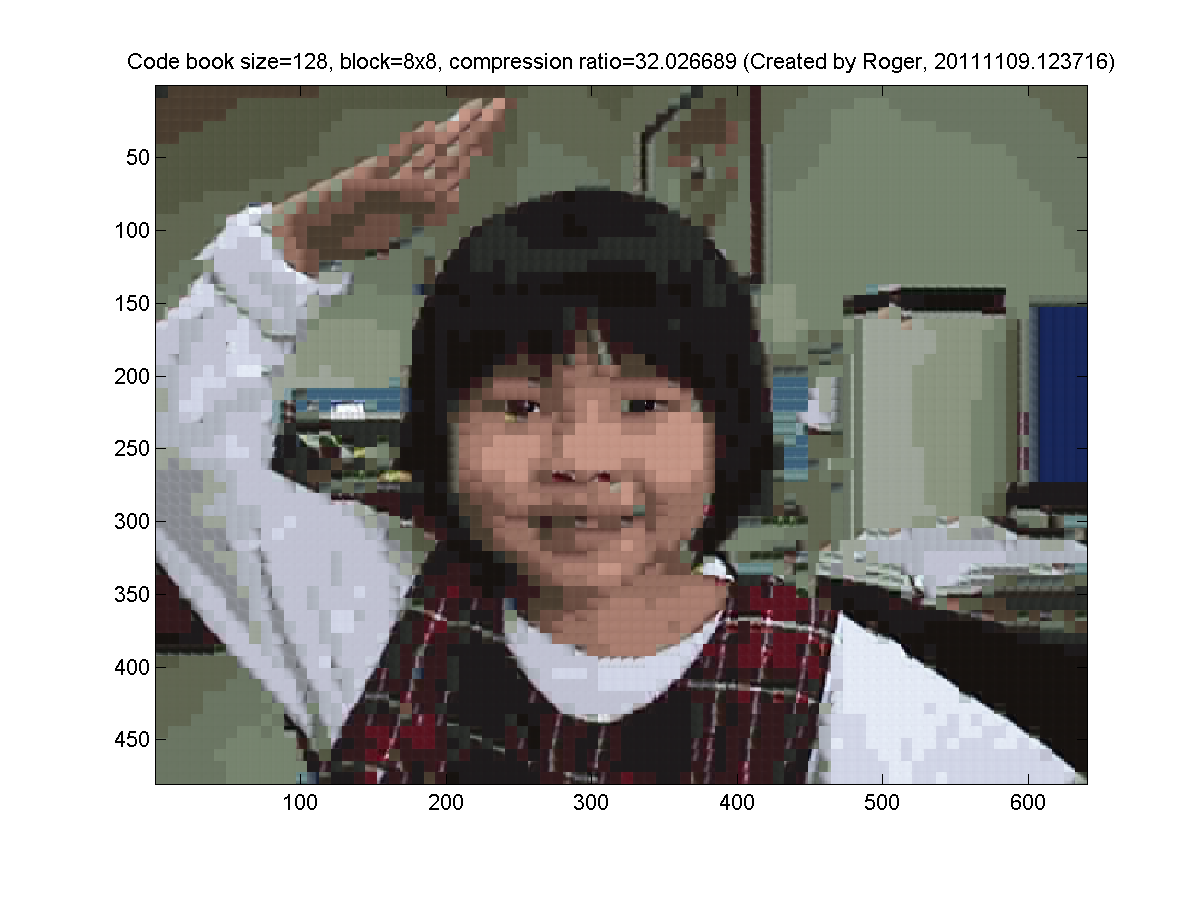
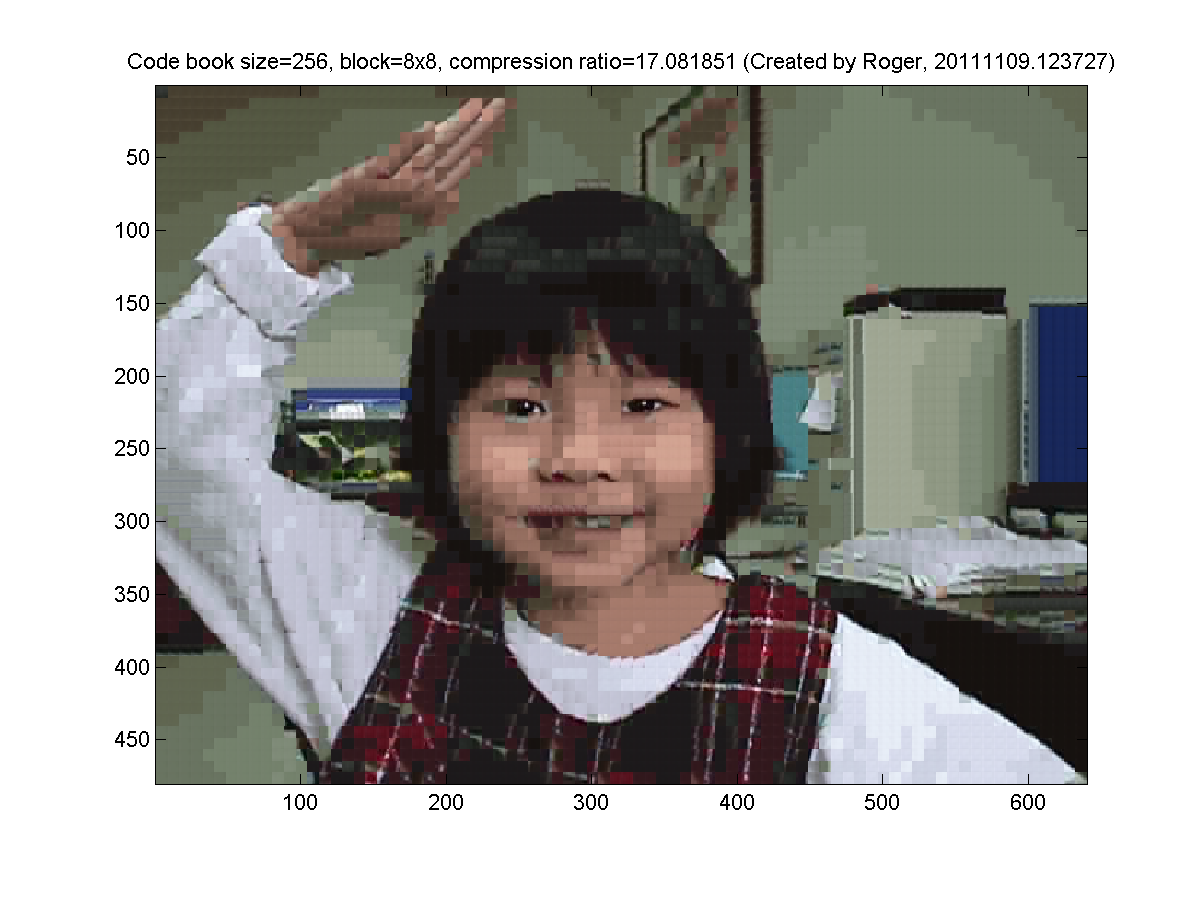
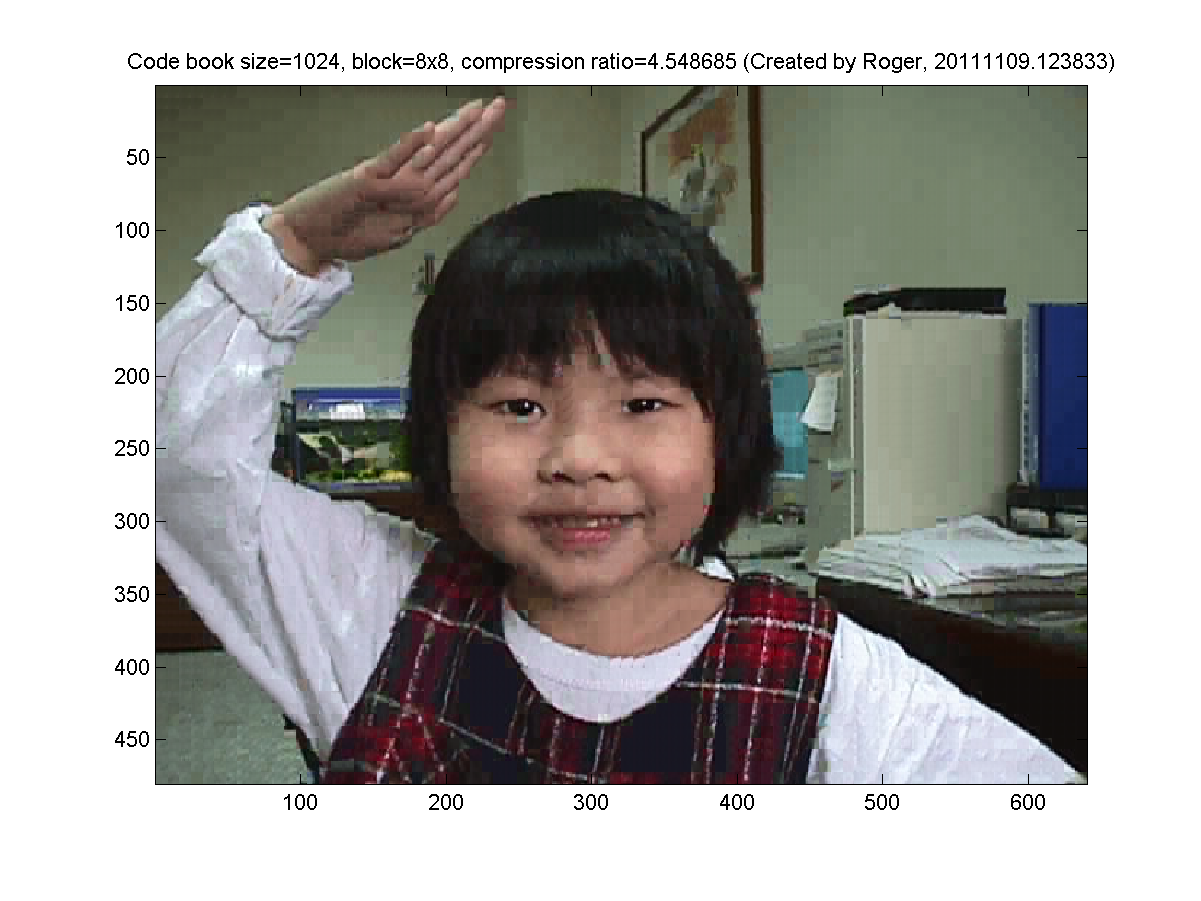
- 8x8 blocks (64 pixels, so the dimension is 3*64=192 for k-means clustering). My results are as follows:
- (***) Use k-means clustering on blocks of images for image compression, with 3 codebooks for R, G, and B: Repeat the previous exercise but use 3 codebooks for R, G, and B. In other words, each layer (R, G, or B) has its own codebook.
- (***)
Image compression function with k-means clustering:
Write a function myImageCompress.m that can perform impage compression on blocks of 8x8, with given number of centers/clusters for k-means clustering. The ussage of the function is as follows:
outImage=myImageCompress(inImage, k) , where- inImage: input true-color image, with dimension mxnx3.
- k: number of clusters (or clusters)
- outImage: output image of mxnx3, where each 8x8 block has already been replaced by the corresponding cluster center obtained via k-means clustering on 8x8 blocks.
Data Clustering and Pattern Recognition (資料分群與樣式辨認)

