如何使用Visual C++ 6.0之Profile功能測試各個function的執行時間
[使用command line mode作profile的方法]
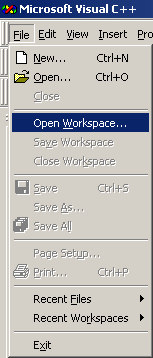
1.首先開啟您的workspace:
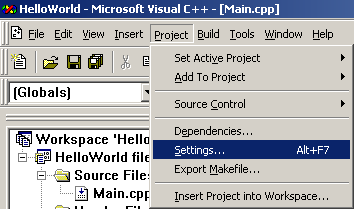
2. 選擇Project -> Settings...
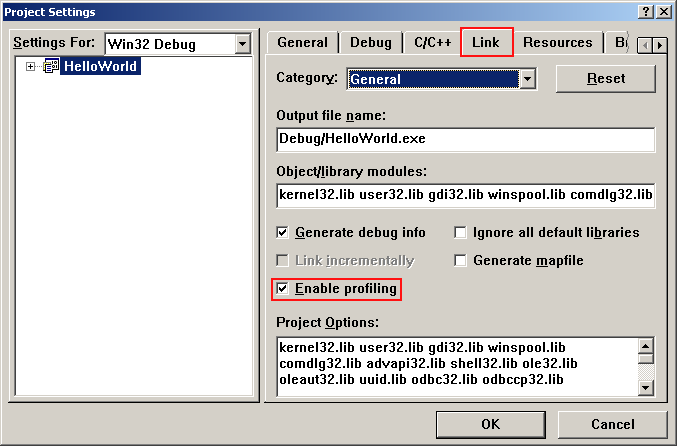
3. 點選Link,勾選Enable profiling. 按OK完成設定.
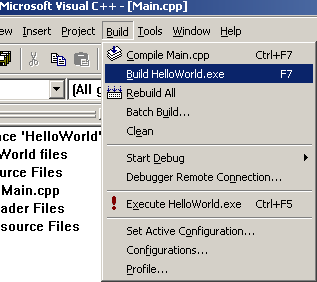
4. Select Build -> "Build" or "Rebuild All" to build your workspace
5. build完成後, 點選Build -> Profile... 會出下如下視窗:
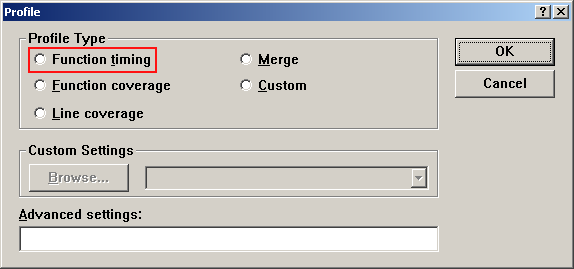
6. 點選Function timing, 表示我們要看每個function執行所花的時間
7. 按OK便關閉視窗,且開始作profiling的動作。
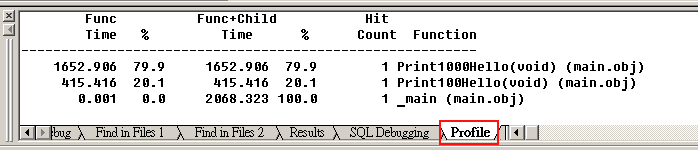
8. Profiling完成後便會在下面的訊息視窗列出Profile的結果:
9. For more detail, please read msdn reference:
10. 以下是我分別列印100次跟1000次HelloWorld(分兩個Function)的profile結果:
Profile: Function timing, sorted by time
Date: Fri Sep 30 23:55:17 2005
Program Statistics
------------------
Command line at 2005 Sep 30 23:55: "D:\PROJECT\HelloWorld\Debug\HelloWorld"
Total time: 2166.598 milliseconds
Time outside of functions: 0.563 millisecond
Call depth: 2
Total functions: 3
Total hits: 3
Function coverage: 100.0%
Overhead Calculated 4
Overhead Average 4
Module Statistics for helloworld.exe
------------------------------------
Time in module: 2166.034 millisecond
Percent of time in module: 100.0%
Functions in module: 3
Hits in module: 3
Module function coverage: 100.0%
Func Func+Child
Hit
Time % Time
% Count Function
-------------------------------------------------------------
1725.777 79.7 1725.777 79.7 1 Print1000Hello(void)
(main.obj)
440.255 20.3 440.255 20.3 1
Print100Hello(void) (main.obj)
0.002 0.0 2166.034 100.0 1 _main
(main.obj)