qcPlot
Plot the results of QC (quadratic classifier)
Contents
Syntax
- qcPlot(DS, qcPrm)
- qcPlot(DS, qcPrm, mode)
- surfObj=qcPlot(DS, qcPrm, ...)
Description
qcPlot(DS, qcPrm) plot the results of QC (quadratic classifier)
- DS: data set used for training
- qcPrm: parameters of QC obtain from qcTrain
qcPlot(DS, qcPrm, mode) uses an additional string variable to specify the type of plot
- mode='2dPdf' for 2D PDF plot
- mode='2dPosterior' for 2D posterior probability plot
- mode='decBoundary' for plot of the decision boundary
surfObj=qcPlot(DS, qcPrm, ...) return the surface object for plotting instead of plotting directly.
Example
This example uses features 3 and 4 of IRIS dataset for classification:
DS=prData('iris');				% Load iris dataset
DS.input=DS.input(3:4, :);			% Use only features 3 and 4
qcPrm=qcTrain(DS);				% Do QC training
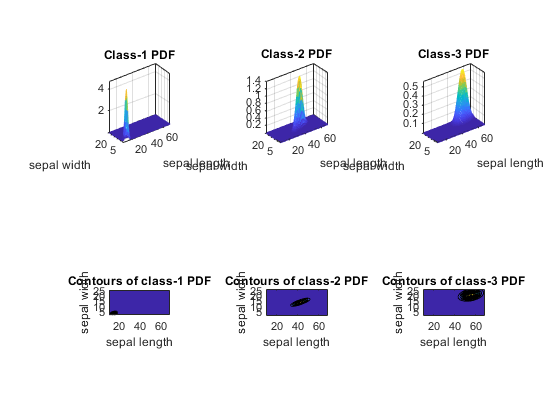
Plot 2D PDF:
figure; qcPlot(DS, qcPrm, '2dPdf');
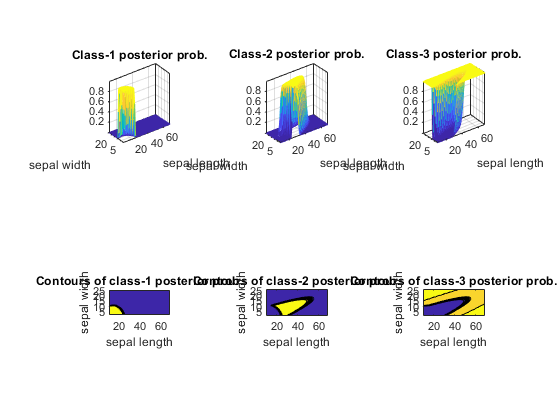
Plot 2D posterior probability:
figure; qcPlot(DS, qcPrm, '2dPosterior');
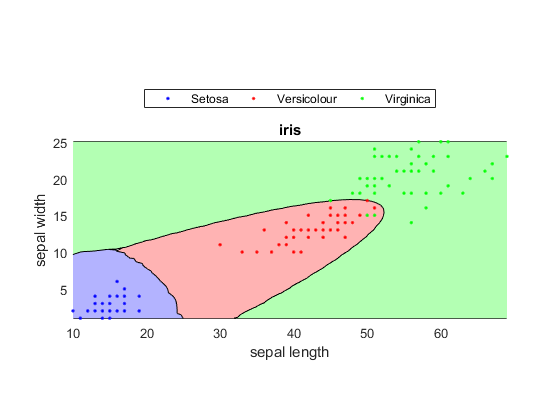
Plot decision boundary:
figure; qcPlot(DS, qcPrm, 'decBoundary');