dsDistPlot
Plot the distribution of features in a data set
Contents
Syntax
- dsDistPlot(DS)
Description
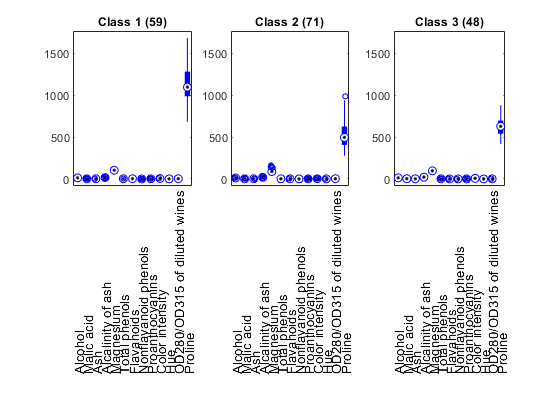
dsDistPlot(DS) plot the range of input variables within DS.
Example
DS=prData('wine');
dsDistPlot(DS);
Plot the distribution of features in a data set
dsDistPlot(DS) plot the range of input variables within DS.
DS=prData('wine');
dsDistPlot(DS);