confMatPlot
Display the confusion matrix
Contents
Syntax
- confMatPlot(confMat)
- confMatPlot(confMat, opt)
Description
confMatPlot(confMat) plots the confusion matrix of classification result.
confMatPlot(confMat, opt) labels the class names along the confusion matrix.
- opt: Options for this function
- opt.mode: different mode of plotting
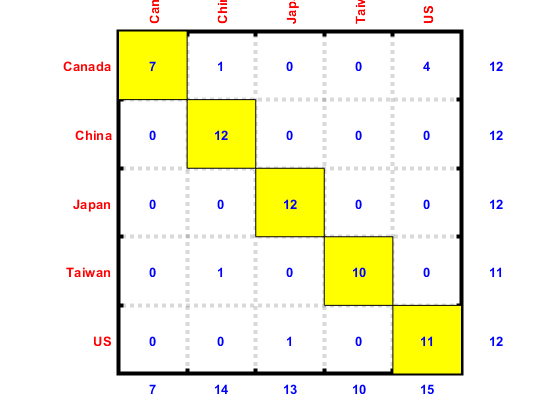
- 'dataCount': displays data counts
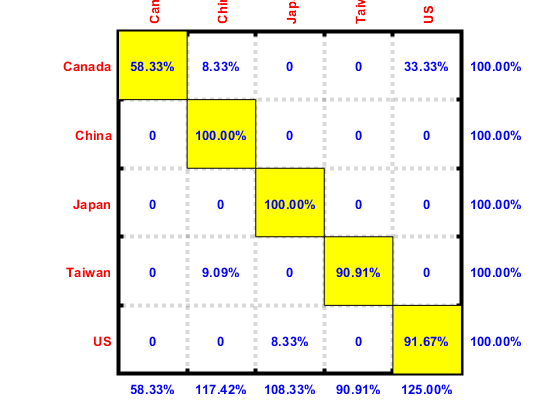
- 'percentage': displays percentages
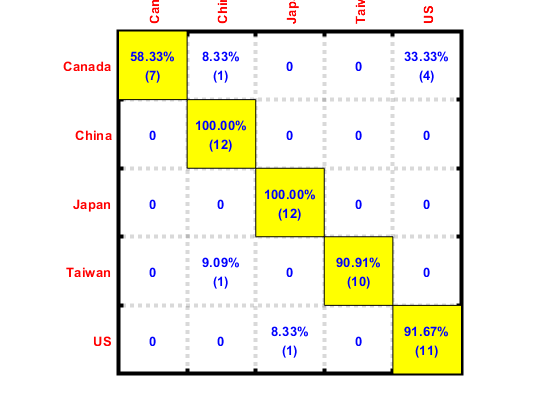
- 'both': displays both data counts and percentages
- opt.className: Class names for plotting
- opt.matPlotOpt: Options that are passed to "matPlot".
- opt.mode: different mode of plotting
Example
desired=[1 1 1 1 1 1 1 1 1 1 1 1 2 2 2 2 2 2 2 2 2 2 2 2 3 3 3 3 3 3 3 3 3 3 3 3 4 4 4 4 4 4 4 4 4 4 4 5 5 5 5 5 5 5 5 5 5 5 5];
computed=[1 5 5 1 1 1 1 1 5 5 1 2 2 2 2 2 2 2 2 2 2 2 2 2 3 3 3 3 3 3 3 3 3 3 3 3 4 4 4 4 4 4 4 4 4 4 2 5 5 5 5 5 5 5 5 3 5 5 5];
confMat = confMatGet(desired, computed);
opt=confMatPlot('defaultOpt');
opt.className={'Canada', 'China', 'Japan', 'Taiwan', 'US'};
% === Example 1: Data count plot
opt.mode='dataCount';
figure; confMatPlot(confMat, opt);
% === Example 2: Percentage plot
opt.mode='percentage';
opt.format='8.2f';
figure; confMatPlot(confMat, opt);
% === Example 3: Plot of both data count and percentage
opt.mode='both';
figure; confMatPlot(confMat, opt);