- To rotate a matrix.
- To find the inverse of a matrix.
- To find the rank of a matrix.
- To compute the reduced row echelon form of a matrix.
- To find the null space of a matrix.
- To compute the eigenvalues and eigenvectors of a matrix.
- To compute QR decomposition of a matrix.
- To compute LU decomposition of a matrix.
- To do singular value decomposition.
- To do discrete Fourier transform
f(n) = 4*(1 - 1/3 + 1/5 - 1/7 + 1/9 - 1/11 + ...),where n is the number of terms in the right-hand-side parentheses.
- (20%) Please submit hardcopy of the M-file pifun.m.
- (20%) Use tic and toc to estimate the overall execution time (or elapsed time) of pifun(10000). (If you don't know how to use tic and toc, get the on-line help by typing help tic and help toc.) On my Pentium-120 with 32MB RAM, the elapsed time is about 0.38 second. Note that MATLAB is an interpreter and you should try NOT to use while- or for-loops since they impose a high overhead on the overall execution time. Try to vectorize your code and make the elapsed time as small as possible. Please list the commands you used to estimate the elapsed time, the elapsed time returned by MATLAB, and your platform on which these commands are executed.
- (10%) Use flops to determine the number of floating point operations used in pifun(10000). If you don't know how to use flops, get the on-line help by typing help flops. Please list the commands you used to estimate the number of floating point operations and the value returned by MATLAB.
fibo(n+2) = fibo(n+1) + fibo(n)and the following initial conditions:
fibo(1) = 0 and fibo(2) = 1Please submit hardcopy of the M-file fibo.m.
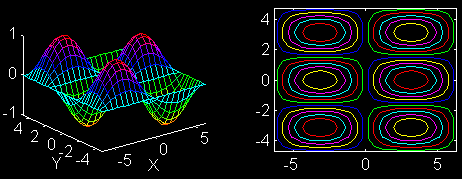
z = sin(x/2)*cos(y),where x should have 21 linearly sampled points along the interval [-2*pi, 2*pi], and y should have 31 linearly samples points along the interval [-1.5*pi, 1.5*pi]. Put the plots in the same figure by using subplot(2,2,1) and subplot(2,2,2) commands. The figure should look like this:

Please submit hardcopies of the plots and the script you used to generated the plots.