
| MATLAB Function Reference |   |
Syntax
stem(Y)stem(X,Y)stem(...,'fill')stem(...,LineSpec)h = stem(...)
Description
產生二維的 stem plot,並從 x 軸上垂直延伸到資料所指定的值。而線段的終點為一圓(預設值)或是其他標記符號(marker),終點的 y-座標值為此資料的數值。
stem(Y)
畫出 Y 的 stem plot。而 x-座標間隔相等並由
MATLAB 自動產生。若 Y 是矩陣格式, stem 會在同一個 x
座標上畫出同個橫列的所有元素。
stem(X,Y)
畫出 X 和 Y 直行的 stem 圖形。 X
和 Y 必須是向量格式或同樣大小的矩陣。另外, X 可以是行向量或列向量,而 Y
矩陣的列數量為 length(X) 。
stem(...,'fill')
決定是否要在 stem 的尾端塗上顏色。
stem(..., 指定 stem plot 的線段格式、標記符號(marker symbol)和顏色。詳情可參閱 LineSpec)
LineSpec。
h = stem(...)
回傳對 line 物件的處理。
Examples
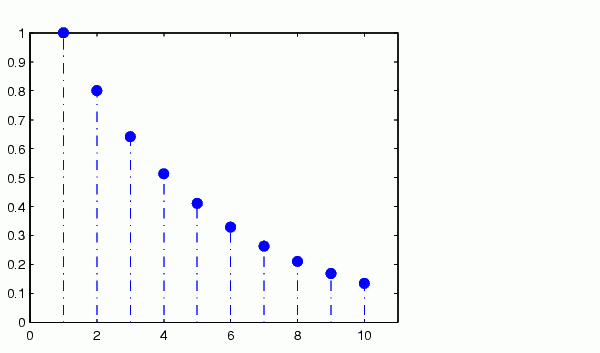
y = linspace(0,2,10);stem(exp(-y),'fill','-.')axis ([0 11 0 1])

See Also
 | std | stem3 |  |