

| MATLAB Function Reference | |
Syntax
pcolor(C)
pcolor(X,Y,C)
h = pcolor(...)
Description
pseudocolor plot 是以 C 來決定顏色的許多小區域(cell)所組成的大形區域。 MATLAB 根據 C 的周圍四點圍成的某個區域(patch,
cell)來畫出 pseudocolor plot。
pcolor(C)
畫出 pseudocolor plot。 C 中的元素對應到目前的
colormap 來決定顏色。而和 colormap 的對應可由 colormap 和 caxis
指令來產生。
pcolor(X,Y,C)
畫出以 X 和 Y 指定 C
區域的座標位置,並由 C 中的元素組合成的 pseudocolor plot圖形。圖形是由點 [X(i,j), Y(i,j)]所組合而成的二維平面四邊形。。 X
和 Y 是用來指定四邊形的座標位置的。若 X 和 Y 是向量,則 X
對應到 C 的直行, Y 對應到 C 的橫列。若 X 和 Y
是矩陣,則矩陣大小和 C 相同。
h = pcolor(...)
回傳對 surface 圖形物件的處理。
Remarks
pseudocolor plot 是從上往下看的平坦表面。 pcolor(X,Y,C)
和用 surf(X,Y,0*Z,C) 並使用 view([0 90])指令所得到的結果相同。
當使用 shading faceted 或 shading flat
時,每個區域(cell)的角落或邊界處的色彩仍然是指定的顏色,而不是漸層顏色的方式。因此, C(i,j) 可決定第 i 橫列和第 j
直行的顏色,而 C 的最後一行和最後一列就不會用到了。
當使用 shading interp
時,每一個小區域(cell)的顏色以 bilinear interpolation 的漸層方式表現。因此,所有 C 元素都會被用到。
Examples
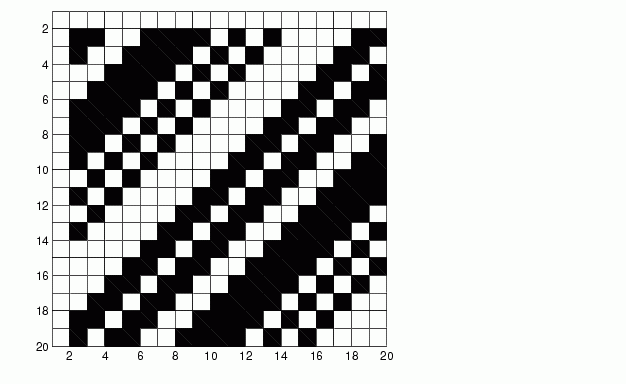
Hadamard matrix 的元素是 +1 和 -1。 colormap
中只有二個元素。下列程式可畫出此矩陣的 pseudocolor plot
pcolor(hadamard(20))
colormap(gray(2))
axis ij
axis square
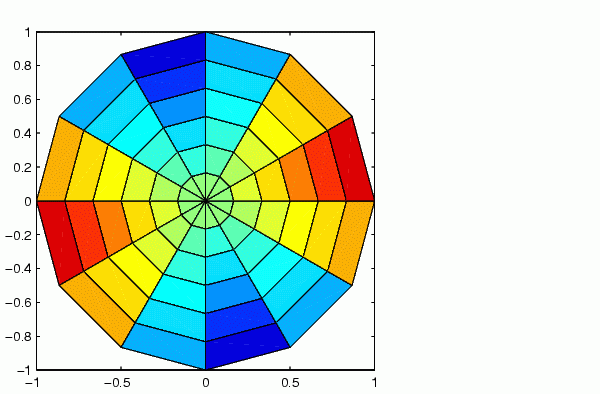
n = 6;
r = (0:n)'/n;
theta = pi*(-n:n)/n;
X = r*cos(theta);
Y = r*sin(theta);
C = r*cos(2*theta);
pcolor(X,Y,C)
axis equal tight
Algorithm
The number of vertex colors for pcolor(C) is the same as the number of cells for image(C). pcolor differs from image in that pcolor(C) specifies the colors of vertices, which are scaled to fit the colormap; changing the axes clim property changes this color mapping. image(C) specifies the colors of cells and directly indexes into the colormap without scaling. Additionally, pcolor(X,Y,C) can produce parametric grids, which is not possible with image.
See Also
caxis, image, mesh, shading, surf, view
| | pcode | pdepe | |