| MATLAB Function Reference | |
Syntax
ezplot3(x,y,z)
ezplot3(x,y,z,[tmin,tmax])
ezplot3(...,'animate')
Description
ezplot3(x,y,z)
在預設的範圍 0 < t < 2 繪製空間曲線 x = x(t), y = y(t), 和 z = z(t)。
ezplot3(x,y,z,[tmin,tmax]) 在預設的範圍 tmin < t < tmax
繪製空間曲線 x = x(t), y = y(t), 和 z = z(t)。
ezplot3(...,'animate') 產生一活躍軌跡的空間曲線。
Remarks
陣列乘法,除了,和乘冪總是在傳送至 ezplot3 表現出來。舉例來說,MATLAB
對於此式子繪製的語法,
x = s./2, y = 2.*s, z = s.^2;
ezplot3('s/2','2*s','s^2')
當傳送至 ezplot3 時 s/2 在字串中取代 s./2。
Examples

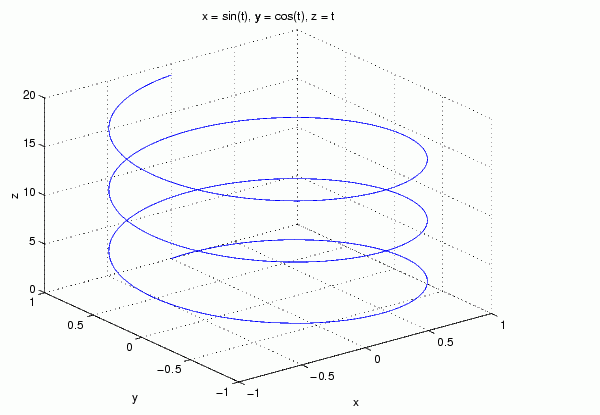
ezplot3('sin(t)','cos(t)','t',[0,6*pi])
See Also
ezcontour, ezcontourf, ezmesh, ezmeshc, ezplot, ezpolar, ezsurf, ezsurfc, plot3
| | ezplot | ezpolar | |