
| MATLAB Function Reference |   |
Three-dimensional contour plot
Syntax
contour3(Z)
contour3(Z,n)
contour3(Z,v)
contour3(X,Y,Z)
contour3(X,Y,Z,n)
contour3(X,Y,Z,v)
contour3(...,LineSpec)
[C,h] = contour3(...)
Description
contour3 creates a three-dimensional contour plot of a surface defined on a rectangular grid.
contour3(Z)
draws a contour plot of matrix Z in a three-dimensional view. Z is interpreted as heights with respect to the x-y plane. Z must be at least a 2-by-2 matrix. The number of contour levels and the values of contour levels are chosen automatically. The ranges of the x- and y-axis are [1:n] and [1:m], where [m,n] = size(Z).
contour3(Z,n)
draws a contour plot of matrix Z with n contour levels in a three-dimensional view.
contour3(Z,v)
draws a contour plot of matrix Z with contour lines at the values specified in vector v. The number of contour levels is equal to length(v). To draw a single contour of level i, use contour(Z,[i i]).
contour3(X,Y,Z), contour3(X,Y,Z,n), and contour3(X,Y,Z,v)
use X and Y to define the x- and y-axis limits. If X is a matrix, X(1,:) defines the x-axis. If Y is a matrix, Y(:,1) defines the y-axis. When X and Y are matrices, they must be the same size as Z, in which case they specify a surface as surf does.
contour3(..., draws the contours using the line type and color specified by LineSpec)
LineSpec.
[C,h] = contour3(...)
returns the contour matrix C as described in the function contourc and a column vector containing handles to graphics objects. contour3 creates patch graphics objects unless you specify LineSpec, in which case contour3 creates line graphics objects.
Remarks
If you do not specify LineSpec, colormap and caxis control the color.
If X or Y is irregularly spaced, contour3 calculates contours using a regularly spaced contour grid, then transforms the data to X or Y.
Examples
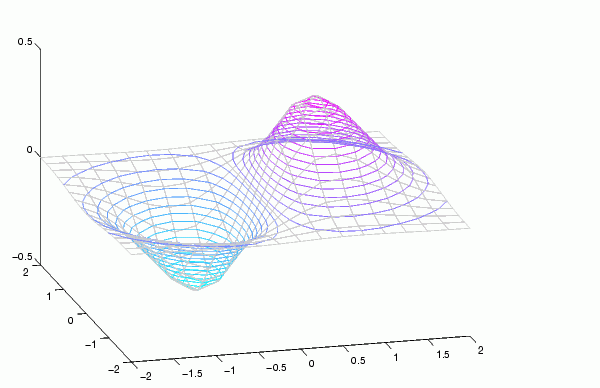
Plot the three-dimensional contour of a function and superimpose a surface plot to enhance visualization of the function.
[X,Y] = meshgrid([-2:.25:2]);
Z = X.*exp(-X.^2-Y.^2);
contour3(X,Y,Z,30)
surface(X,Y,Z,'EdgeColor',[.8 .8 .8],'FaceColor','none')
grid off
view(-15,25)
colormap cool

See Also
contour, contourc, meshc, meshgrid, surfc
 | contour | contourc |  |