MATLAB �� spy ���O�i�Ω��[�ݵ}���x�}���D�s�������G���p�A�Ҧp�G
�b�W�z�o�ӽd�Ҥ��A�x�} west0479 �����O 479*479�A���O�u�]�t 1887 �ӫD�s�����A�]�����x�}���K�ץu�� 1887/(479*479) = 0.0082�C
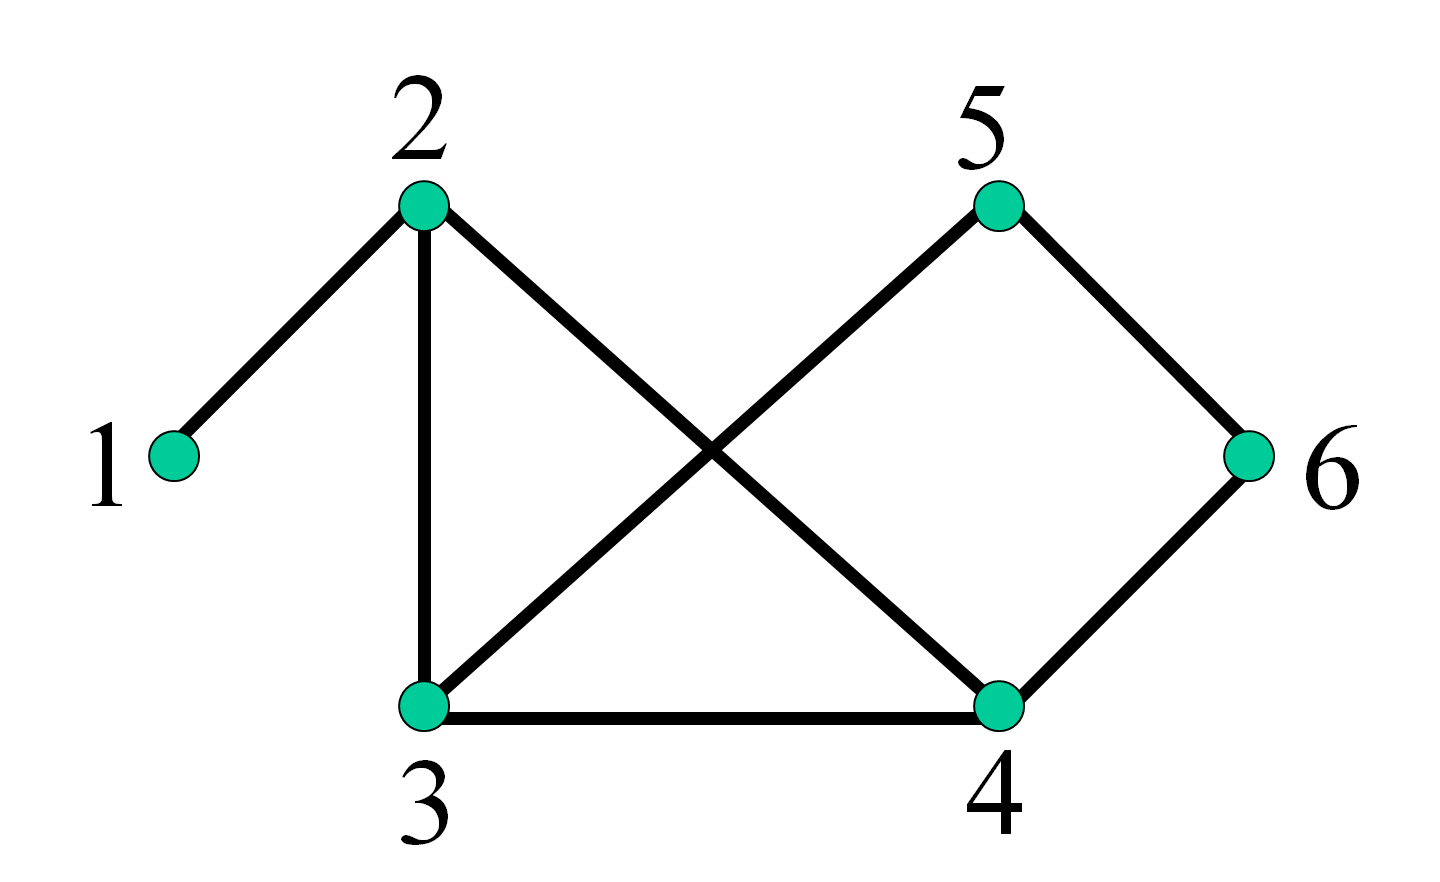
���~�A�}���x�}�S�O�A�Ω���ܤ@�ӡu�L�V�ϡv�]Undirected Graph�^���u�F��x�}�v�]Adjacency Matrix�^�A ²��a���A�Y�Y�Ϫ��� i �M�� j �Ӹ`�I�����u�s���A�h��۹������F��x�}�b�� i �C�B�� j �檺�����Ȭ� 1�A ��L�����ȫh���s�C�H�U�Ϭ��һ����G
�h�������F��x�}�i���ܦ��G
���]�o 6 �Ӹ`�I���y�ЬO (0, 1)�B(1, 2)�B(1, 0)�B(2, 0)�B(2, 2)�B(3, 1)�A�h�ڭ̥i�� gplot ���O�ӵe�X�W�z���L�V�ϡG
�䤤 '-o' �N���H��u�]'-'�^�ζ��]'o'�^�ӧ@�ϡC
�t�@�Ӧ��쪺�Ҥl�O Bucky �y�A���ϥ]�t�F 60 �ӤT�תŶ������I�A�C�@�I�M�L���T�ӾF���I���O���Z���A�i�� bucky ���O�Ӳ��ͳo���I���F��x�}�A�å� gplot ����ܹϧΡA�Ҧp�G
�ѤW�ϥi�ݥX�ABucky �y�N�ϩ��O�@�ӥѦh�Ӥ����M�����K���ҧΦ������y�C
�t�@�ӱ`�Ψӵe�X��H�ϧΪ����O�O treeplot�A�ڭ̥i�Φ����O�ӵe�X�@�ʹq���ϾǤ�����A�Ш��U�C�d�ҡG
�b�W�z�d�Ҥ��A�ڭ̨ϥ� nodes �V�q�ӥN���o�@�ʾ�A�䤤 node(1)=0 �h�N���Ĥ@�Ӹ`�I�O���𪺮ڸ`�I�]Root�^�A�� node(i)=j �N���� i �Ӹ`�I�����ˬO�� j �Ӹ`�I�A�Ҧp node(5)=4 �N����5�Ӹ`�I�����ˬO�� 4 �Ӹ`�I�A�̦������CŪ�̥i�H�̦����סA�b�W�z�d�Ҥ����𤤡A�̧ǼХX�C�@�Ӹ`�I�����ޡC�ڭ̤]�i�H�ϥε{���X�ӼХX�C�@�Ӹ`�I�����ޡA�p�U�d�ҩҥܡA�A�й�F�ܡH
�٦��@�Ӧ��쪺�Ҥl�A�O�� NASA �]����Ӫ��`�p�^�ҥD�ɪ��p�e�A�䤤�]�t�p��y�L���l����y�ҳy�����@�ΤO�A�ѩ��i�氾�L����{���ƭȹB��A�ҥH������G���Ŷ��i��T���Ƥ��ΡA��F��x�}�Y���@�ӵ}���x�}�A�z�i�b MATLAB �U���� showdemo airfoil.m ���O�Y�i���ͬ����ϧΤλ����A�b�����A�حz�C
MATLAB�{���]�p�G�i���g
