
| MATLAB Function Reference |   |
Syntax
rectangle
rectangle('Position',[x,y,w,h])
rectangle(...,'Curvature',[x,y])
h = rectangle(...)
Description
rectangle draws a rectangle with Position [0,0,1,1] and Curvature [0,0] (i.e., no curvature).
rectangle('Position',[x,y,w,h]) draws the rectangle from the point x,y and having a width of w and a height of h. Specify values in axes data units.
Note that, to display a rectangle in the specified proportions, you need to set the axes data aspect ratio so that one unit is of equal length along both the x and y axes. You can do this with the command axis equal or daspect([1,1,1]).
rectangle(...,'Curvature',[x,y]) specifies the curvature of the rectangle sides, enabling it to vary from a rectangle to an ellipse. The horizontal curvature x is the fraction of width of the rectangle that is curved along the top and bottom edges. The vertical curvature y is the fraction of the height of the rectangle that is curved along the left and right edges.
The values of x and y can range from 0 (no curvature) to 1 (maximum curvature). A value of [0,0] creates a rectangle with square sides. A value of [1,1] creates an ellipse. If you specify only one value for Curvature, then the same length (in axes data units) is curved along both horizontal and vertical sides. The amount of curvature is determined by the shorter dimension.
h = rectangle(...) returns the handle of the rectangle object created.
Remarks
Rectangle objects are 2-D and can be drawn in an axes only if the view is [0 90] (i.e., view(2)). Rectangles are children of axes and are defined in coordinates of the axes data.
Examples
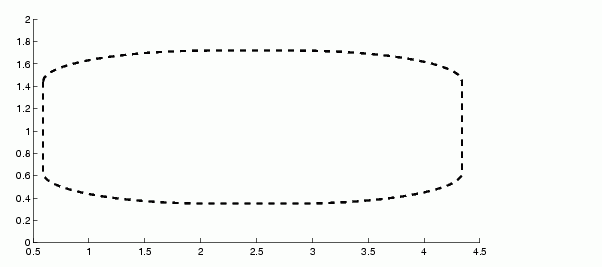
This example sets the data aspect ratio to [1,1,1] so that the rectangle displays in the specified proportions (daspect). Note that the horizontal and vertical curvature can be different. Also, note the effects of using a single value for Curvature.
rectangle('Position',[0.59,0.35,3.75,1.37],...
          'Curvature',[0.8,0.4],...
         'LineWidth',2,'LineStyle','--')
daspect([1,1,1])

Specifying a single value of [0.4] for Curvature produces:
A Curvature of [1] produces a rectangle with the shortest side completely round:
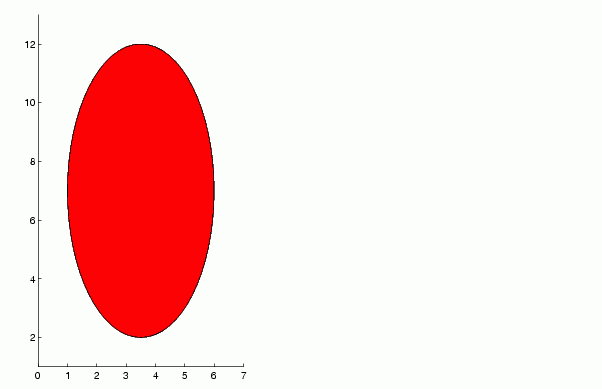
This example creates an ellipse and colors the face red.
rectangle('Position',[1,2,5,10],'Curvature',[1,1],...
          'FaceColor','r')
daspect([1,1,1])
xlim([0,7])
ylim([1,13])

See Also
line, patch, plot, plot3, set, text, rectangle properties
Object Hierarchy
Setting Default Properties
You can set default rectangle properties on the axes, figure, and root levels.
set(0,'DefaultRectangleProperty',PropertyValue...)
set(gcf,'DefaultRectangleProperty',PropertyValue...)
set(gca,'DefaultRectangleProperty',PropertyValue...)
Where Property is the name of the rectangle property whose default value you want to set and PropertyValue is the value you are specifying. Use set and get to access the surface properties.
Property List
The following table lists all rectangle properties and provides a brief description of each. The property name links take you to an expanded description of the properties.
| Property Name |
Property Description |
Property Value |
| Defining the Rectangle Object | ||
Curvature |
Degree of horizontal and vertical curvature |
Value: two-element vector with values between 0 and 1Default: [0,0] |
EraseMode |
Method of drawing and erasing the rectangle (useful for animation) |
Values: normal, none, xor, backgroundDefault: normal |
EdgeColor |
Color of rectangle edges |
Value: Colorspec or noneDefault: ColorSpec [0,0,0] |
FaceColor |
Color of rectangle interior |
Value: Colorspec or noneDefault: none |
LineStyle |
Line style of edges |
Values: -, --, :, -., noneDefault: - |
LineWidth |
Width of edge lines in points |
Value: scalar Default: 0.5 points |
Position |
Location and width and height of rectangle |
Value: [x,y,width,height]Default: [0,0,1,1] |
| General Information About Rectangle Objects | ||
Children |
Rectangle objects have no children |
|
Parent |
Axes object |
Value: handle of axes |
Selected |
Indicate if the rectangle is in a "selected" state. |
Value: on, off Default: off |
Tag |
User-specified label |
Value: any string Default: '' (empty string) |
Type |
The type of graphics object (read only) |
Value: the string 'rectangle' |
|
User-specified data |
Value: any matrix Default: [] (empty matrix) |
| Properties Related to Callback Routine Execution | ||
|
Specify how to handle callback routine interruption |
Value: cancel, queue Default: queue |
|
Define a callback routine that executes when a mouse button is pressed on over the rectangle |
Value: string Default: '' (empty string) |
|
Define a callback routine that executes when a rectangle is created |
Value: string Default: '' (empty string) |
|
Define a callback routine that executes when the rectangle is deleted (via close or delete) |
Values: string Default: '' (empty string) |
|
Determine if callback routine can be interrupted |
Values: on, off Default: on (can be interrupted) |
|
Associate a context menu with the rectangle |
Values: handle of a Uicontextmenu |
| Controlling Access to Objects | ||
HandleVisibility |
Determines if and when the rectangle's handle is visible to other functions |
Values: on, callback, offDefault: on |
HitTest |
Determines if the rectangle can become the current object (see the Figure CurrentObject property) |
Values: on, off Default: on |
| Controlling the Appearance | ||
Clipping |
Clipping to axes rectangle |
Values: on, offDefault: on |
SelectionHighlight |
Highlight rectangle when selected (Selected property set to on) |
Values: on, off Default: on |
Visible |
Make the rectangle visible or invisible |
Values: on, off Default: on |
 | record | rectangle properties |  |