
| MATLAB Function Reference |   |
Syntax
ezplot(f)
ezplot(f,[min,max])
ezplot(f,[xmin,xmax,ymin,ymax])
ezplot(x,y)
ezplot(x,y,[tmin,tmax])
ezplot(...,figure)
Description
ezplot(f) 繪製函式 f = f(x) 在預設的範圍:-2 < x < 2
 。
。
ezplot(f,[min,max]) 繪製 f = f(x)
在範圍:min < x < max。
ezplot(f) 繪製 f(x,y) = 0 在預設的範圍 -2 < x < 2
 , -2
, -2 < y < 2
 。
。
ezplot(f,[xmin,xmax,ymin,ymax]) 繪製 f(x,y) = 0
在 xmin < x < xmax
和 ymin < y < ymax
的範圍之間。
ezplot(f,[min,max])plots f(x,y) = 0
在 min < x < max
和 min < y < max
的範圍之間。
若 f 為變數 u 和 v 所組成的函數,則其邊界點 umin, umax, vmin,
和 vmax 會依字母順序排序。因此,ezplot('u^2 - v^2 - 1',[-3,2,-2,3]) 繪製 u2 - v2 - 1 = 0
在 -3 < u < 2, -2 < v < 3 的範圍內。
ezplot(x,y) 繪製平面曲線 x = x(t) 及 y = y(t)
在預設的範圍 0 < t < 2 。
。
ezplot(x,y,[tmin,tmax]) 繪製 x = x(t)
及 y = y(t) 在 tmin < t < tmax
的範圍之間。
ezplot(...,figure) 依所定義的頭銜 figure
繪製其函數。
Remarks
矩陣乘法,除法,及乘冪總是在傳送 ezplot 有所表示。舉例來說,MATLAB
對等高線繪製的語法。
sqrt(x.^2 - y.^2)
ezplot('sqrt(x^2 - y^2)')
Examples
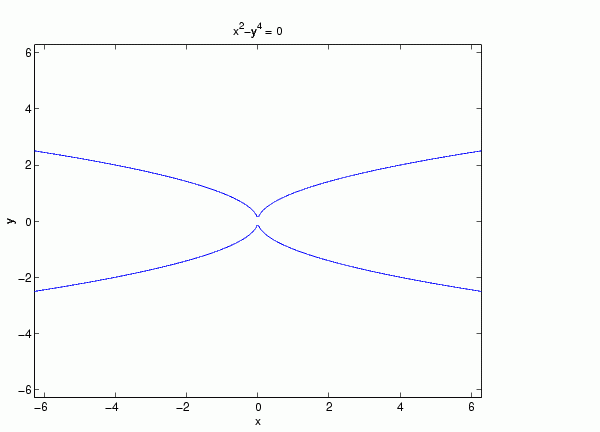
ezplot('x^2-y^4')

See Also
ezcontour, ezcontourf, ezmesh, ezmeshc, ezplot3, ezpolar, ezsurf, ezsurfc, plot
 | ezmeshc | ezplot3 |  |