Timbre is an acoustic feature that is defined conceptually. In general, timbre refers to the "content" of a frame of audio signals, which is ideally not affected much by pitch and intensity. Theoretically, for quasi-periodic audio signals, we can use the waveform within a fundamental period as the timbre of the frame. However, it is difficult to analysis the waveform within a fundamental period directly. Instead, we usually use the fast Fourier transform (or FFT) to transform the time-domain waveform into frequency-domain spectrum for further analysis. The amplitude spectrum in the frequency domain simply represent the intensity of the waveform at each frequency band.
「音色」(Timber)是一個很模糊的名詞,泛指音訊的內容,例如「天書」這兩個字的發音,雖然都是第一聲,因此它們的音高應該是蠻接近的,但是由於音色的不同,我們可以分辨這兩個音。直覺來看,音色的不同,代表基本週期的波形不同,因此我們可以使用基本週期的波形來代表音色。若要從基本週期的波形來直接分析音色,是一件很困難的事。通常我們的作法,是將每一個音框進行頻譜分析(Spectral Analysis),算出一個音框訊號如何可以拆解成在不同頻率的分量,然後才能進行比對或分析。在頻譜分析時,最常用的方法就是「快速傅立葉轉換」(Fast Fourier Transform),簡稱 FFT,這是一個相當實用的方法,可以將在時域(Time Domain)的訊號轉換成在頻域(Frequency Domain)的訊號,並進而知道每個頻率的訊號強度。
If you want to experience real-time FFT demo, type the following command within the MATLAB command window:
若要看看 FFT 的實際展示,可以輸入下列指令:
- dspstfft_nt (MATLAB 5)
- dspstfft_win32 (MATLAB 6 and 7)
- dspstfft_audio (MATLAB 7.12 or later)
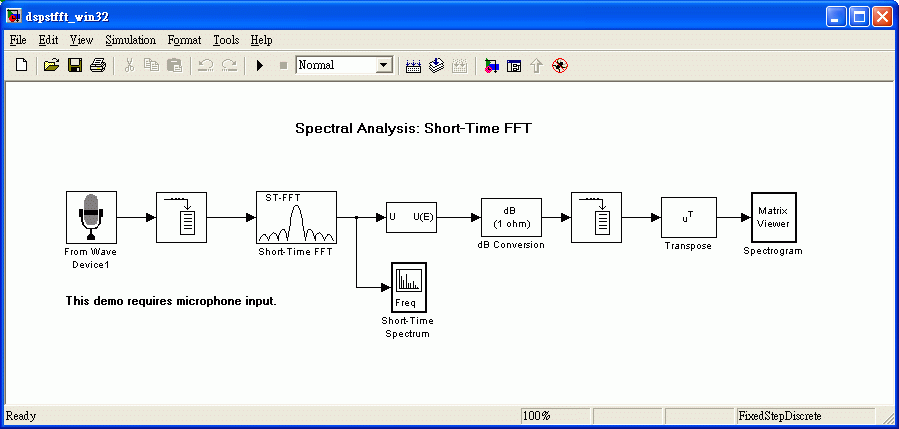
The opened Simulink block system looks like this:
開啟的 Simulink 系統如下:

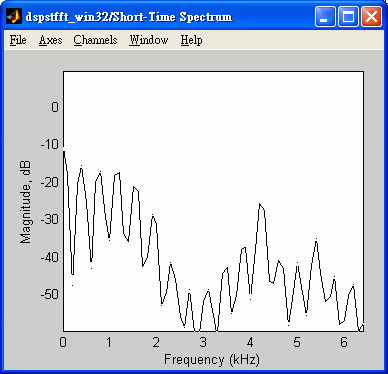
When you start running the system and speak to the microphone, you will able to see the time-varying spectrum:
當你啟動程式並開始對麥克風說話時,就會出現下列動態的「頻譜圖」(Spectrum),隨時間而呈現急遽的變化:

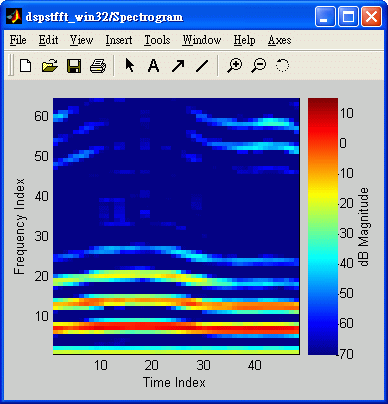
If we use different colors to represent the height of spectrum, we can obtain the spectrogram, as shown next:
若將頻譜圖「立」起來,並用不同的顏色代表頻譜圖的高低,就可以得到頻譜對時間所產生的影像,稱為 Spectrogram,如下:

Spectrogram represent the time-varying spectrum displayed in a image map. The same utterance will correspond to the same pattern of spectrogram. Some experienced persons can understand the contents of the speech by viewing the spectragram alone. This is call "spectrogram reading" and related contests and information can be found on the Internet. For instance:
Spectrogram 代表了音色隨時間變化的資料,因此有些厲害的人,可以由 Specgrogram 直接看出語音的內容,這種技術稱為 Specgrogram Reading,有興趣的同學,可以在搜尋引擎上找到很多相關的網頁,也可以試試自己的功力。
- http://cslu.cse.ogi.edu/tutordemos/SpectrogramReading/spectrogram_reading.html
- http://home.cc.umanitoba.ca/~robh/howto.html
Audio Signal Processing and Recognition (音訊處理與辨識)
