- (*) Onset detection for noisy tapping recordings: Here we have a recording of tapping in a noisy environment. Please design a procedure to identify the onsets correctly. The ground-truth ontsets are already recorded in the wave file, so you can follow this example to demonstrate the ground-truth onsets and the identified ones. (Hint: You can use a high-pass filter to eliminate the low-frequency noises before performing onset detection.)
- (**)
Parameter optimization for onset detection:
As mentioned in the text, the value of volume ratio is critical for successful onset detection. In paticular, if the volume ratio is high, we are likely to have deletion errors. On the other hand, the the volume ratio is low, we are likely to have insertion errors. In this exercise, you are requested to use exhaustive search to find the optimum value of volume ratio. In other words, you need to change the volume ratio from 0.1 to 0.9 (with a step of 0.1) and count the instances of insertions and deletions. Plot the results in two different ways:
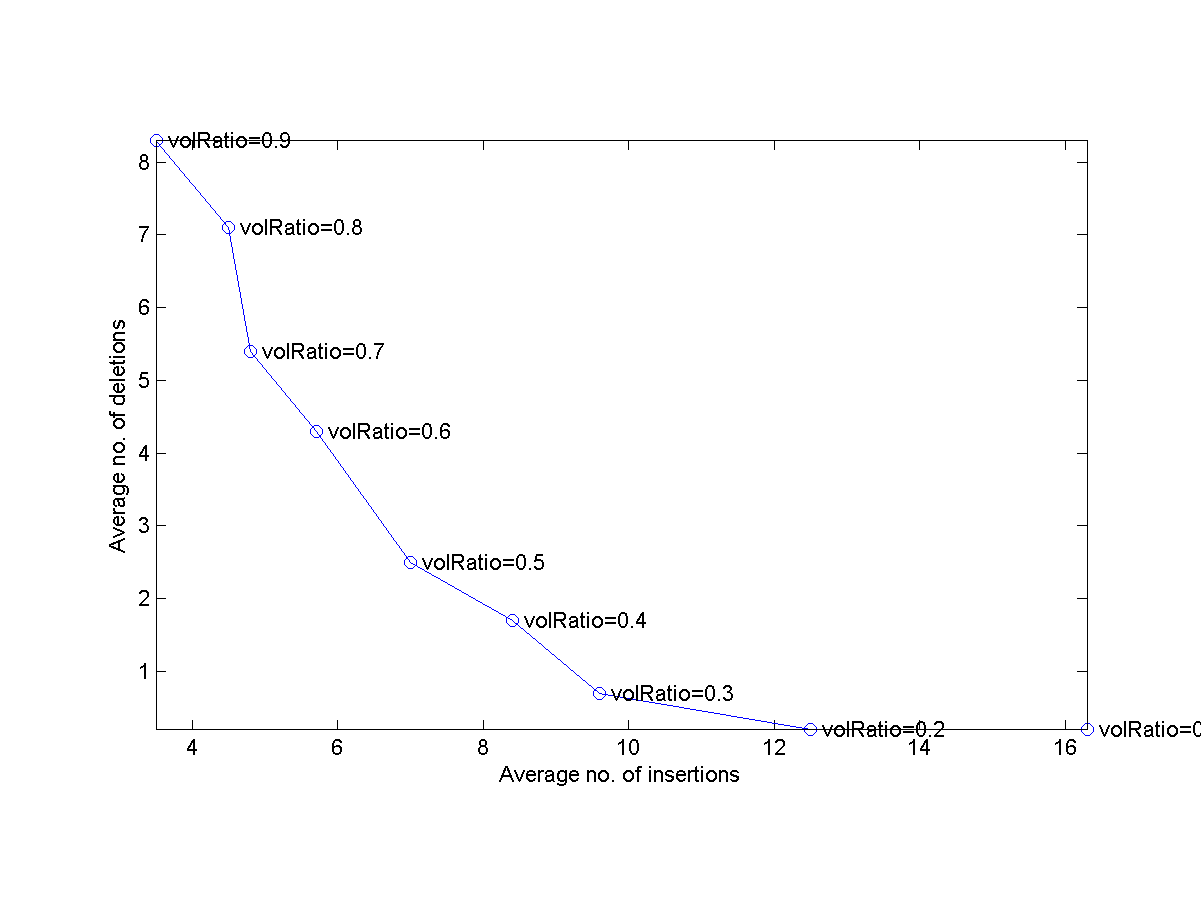
- In the first plot, let x-axis be the average no. of insertions, y-axis be the average no. of deletion, and label each data point with the volume ratio used. Your plot should similar to the one shown next:

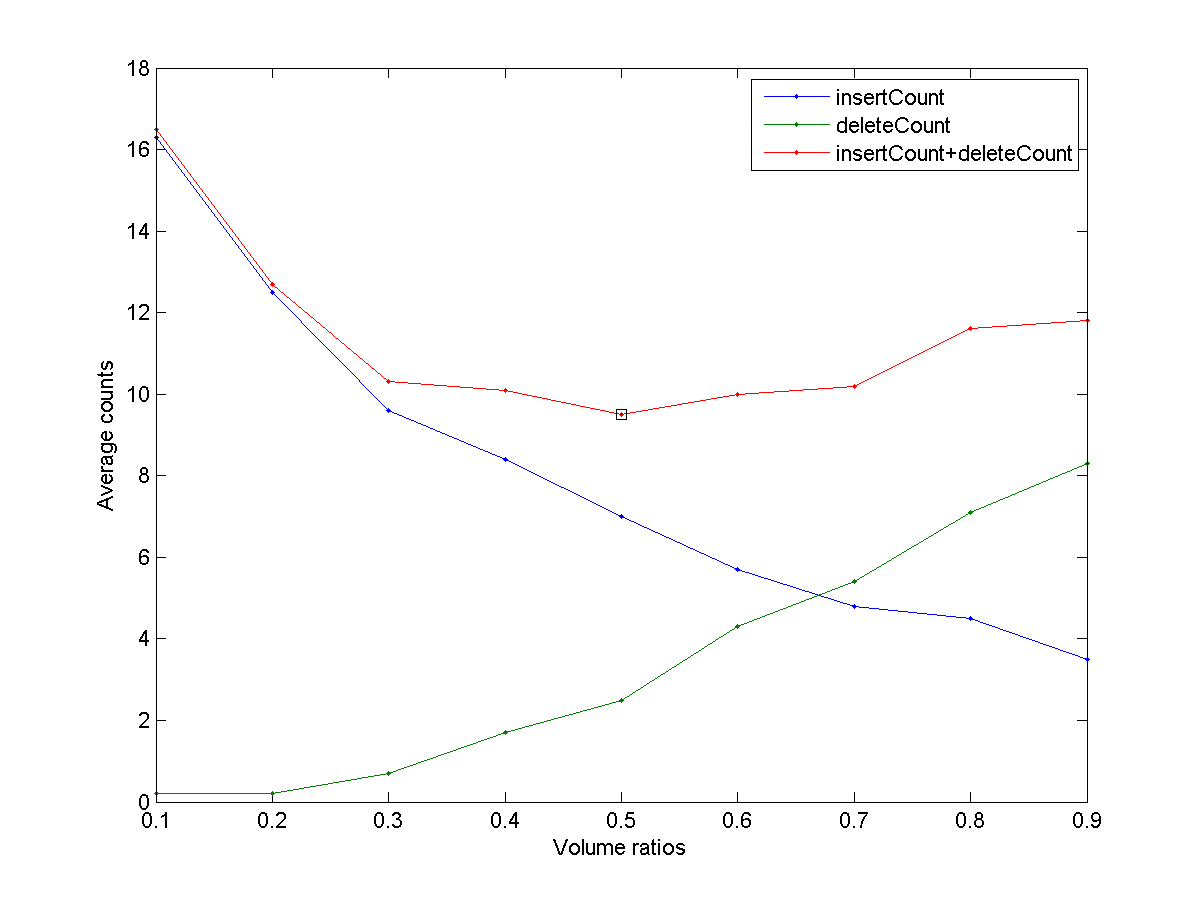
- In the second figure, plot 3 curves corresponding to inertion counts, deletion counts, and their summation. What is the value of volume ratio which will lead to the minimum total count of insertions and deletions? Your plot should be similar to the one shown next:

- In the third figure, plot the f-measures with respect to the volume ratio. What is the volume ratio that let the f-measure reaches its maximum? Is is the same as in the previous one?
Note that:
- You can use simSequence.m available at the Machine Learning toolbox to compute the insertion/deletion counts of two onset vectors. The above plot was obtained with a tolerance equal to 0.02*fs.
- Since this is a time-consumping process, you should use a partial set of the corpus to test the correctness of your program. For instance, you can use your own recordings for your program first. This also helps to verify if your recordings are ok or not.
- TA can show you where to download the corpus.
- (***)
Programming contest: query by tapping:
In this exercise, you are required to implement a QBT comparison method and evaluate its performance. In particular, you need to implement a function
ioiDistance.mwhich compute the distance between two IOI vectors. Demonstrate the performance of your comparison method by using the corpus provided by TA. Note that- Example code can be download from here. After downloading it, you can run
goTestdirectly to get a basic recognition rate. - Change
waveDirwithinqbtPrmSet.mto point to the corpus directory, so you can run the program on the real stuff. - You need to perform onset detection. As a result, the parameter optimization for onset detection in the previous exercise is important for optimizing the whole system. You can embedded the best parameter in
odPrmSet.m. You can also add or modify parameters inodPrmSet.m. (For instance, you can set the useHighPassFilter option to be 1.) - As usually, you need to briefly explain your method in the file
method.txt. - You can run
goOdCheckto check the result of onset detection of each wave file. - After running
goTest, you can rungoPersonalRecogRateto get the recognition rate of each person. - Upload all files that you have modified, such that TA can run your program to get the final recognition rate. (For instance, if you have modified
ioiDistance.m, upload it so TA will use your version to run your program to get the recognition. If you don't upload it, TA will use the defaultioiDistance.min the SAP toolbox.) - You do not need to upload the main program
goTest.m. This will not be used by TA to run your program.
- Example code can be download from here. After downloading it, you can run
- In the first plot, let x-axis be the average no. of insertions, y-axis be the average no. of deletion, and label each data point with the volume ratio used. Your plot should similar to the one shown next:
Audio Signal Processing and Recognition (音訊處理與辨識)
