[english ][all ] (請注意:中文版本並未隨英文版本同步更新! )
首先我們來介紹如何在時域進行音高追蹤。
第一種方法,是直接使用音量來進行端點偵測的方法。這是一種最簡單的方法,只要音量小於某個門檻值,我們就認定是靜音或是雜訊,至於這個門檻值如何決定,除了靠人的直覺外,比較客觀的方法,還是靠大量的測試資料來決定最佳值。
Hint 在計算音量時,請務必記得要先經過零點校正。
下列這個範例使用音量來對 sunday.wav 進行端點偵測。在此範例中,我們使用 4 種不同方法來計算音量門檻植,並將結果畫出來以便觀察,如下:
Example 1: epdByVolTh01.m waveFile='sunday.wav';
au=myAudioRead(waveFile); y=au.signal; fs=au.fs;
frameSize = 256;
overlap = 128;
y=y-mean(y); % zero-mean substraction
frameMat=buffer2(y, frameSize, overlap); % frame blocking
frameNum=size(frameMat, 2); % no. of frames
volume=frame2volume(frameMat); % volume
volumeTh1=max(volume)*0.1; % volume threshold 1
volumeTh2=median(volume)*0.1; % volume threshold 2
volumeTh3=min(volume)*10; % volume threshold 3
volumeTh4=volume(1)*5; % volume threshold 4
index1 = find(volume>volumeTh1);
index2 = find(volume>volumeTh2);
index3 = find(volume>volumeTh3);
index4 = find(volume>volumeTh4);
endPoint1=frame2sampleIndex([index1(1), index1(end)], frameSize, overlap);
endPoint2=frame2sampleIndex([index2(1), index2(end)], frameSize, overlap);
endPoint3=frame2sampleIndex([index3(1), index3(end)], frameSize, overlap);
endPoint4=frame2sampleIndex([index4(1), index4(end)], frameSize, overlap);
subplot(2,1,1);
time=(1:length(y))/fs;
plot(time, y);
ylabel('Amplitude'); title('Waveform');
axis([-inf inf -1 1]);
line(time(endPoint1( 1))*[1 1], [-1, 1], 'color', 'm');
line(time(endPoint2( 1))*[1 1], [-1, 1], 'color', 'g');
line(time(endPoint3( 1))*[1 1], [-1, 1], 'color', 'k');
line(time(endPoint4( 1))*[1 1], [-1, 1], 'color', 'r');
line(time(endPoint1(end))*[1 1], [-1, 1], 'color', 'm');
line(time(endPoint2(end))*[1 1], [-1, 1], 'color', 'g');
line(time(endPoint3(end))*[1 1], [-1, 1], 'color', 'k');
line(time(endPoint4(end))*[1 1], [-1, 1], 'color', 'r');
legend('Waveform', 'Boundaries by threshold 1', 'Boundaries by threshold 2', 'Boundaries by threshold 3', 'Boundaries by threshold 4');
subplot(2,1,2);
frameTime=frame2sampleIndex(1:frameNum, frameSize, overlap);
plot(frameTime, volume, '.-');
ylabel('Sum of Abs.'); title('Volume');
axis tight;
line([min(frameTime), max(frameTime)], volumeTh1*[1 1], 'color', 'm');
line([min(frameTime), max(frameTime)], volumeTh2*[1 1], 'color', 'g');
line([min(frameTime), max(frameTime)], volumeTh3*[1 1], 'color', 'k');
line([min(frameTime), max(frameTime)], volumeTh4*[1 1], 'color', 'r');
legend('Volume', 'Threshold 1', 'Threshold 2', 'Threshold 3', 'Threshold 4');
在上述的範例中,我們使用了三個音量門檻值來進行端點偵測:
音量最大值的 0.1:此方法在音量忽大忽小時或雜訊太強時,會發生錯誤。
音量最小值的 5 倍:此方法在雜訊太強時,會發生錯誤。
第一個音框的音量的 4 倍:此方法假設一開始是靜音,但若一開始就有聲音,或是錄音器材一開始有偏移,此做法就很容易發生錯誤。
Example 2: epdByVol01.m waveFile='singaporeIsAFinePlace.wav';
au=myAudioRead(waveFile);
opt=endPointDetect('defaultOpt');
opt.method='vol';
showPlot=1;
endPoint=endPointDetect(au, opt, showPlot);
volTh=(volMax-volMin)*epdPrm.volRatio+volMin;
當然,上述方法中的相關參數值(0.1、5、4 等值),都只能適用於這個音訊檔案,若要找出對其他聲音也完全適用的參數值,就要靠大量資料的測試才能得到。
當然,你也可以靠你的創意和智慧,別出心裁,想一個決定音量門檻植的最佳方法,例如採用音量最大值和最小值的加權平均等等。
若是聲音很乾淨,雜訊不大,那麼使用音量來偵測端點可得到不錯的效果。但是如果碰到下列問題,這個簡單的方法就行不通:
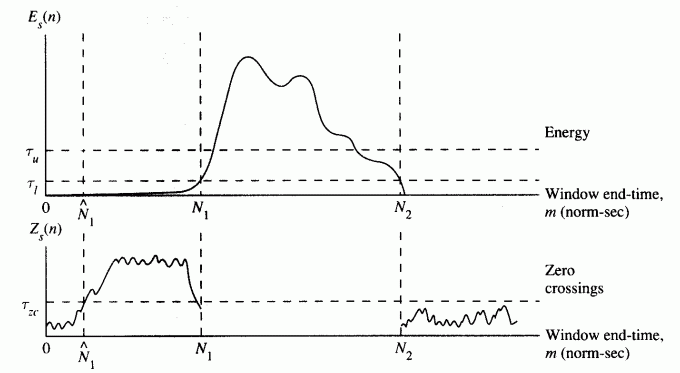
此時單一音量門檻值的選取就比較不容易,端點偵測的正確率也會下降。另外,對一般端點偵測而言,若希望求得高準確度的端點,我們可以讓音框和音框之間的重疊部分加大,但是相對而言,計算量也會跟著變大。第二種常用的方法方法,則是用到了音量和過零率,簡述如下:
以高音量門檻值(t u )為標準,決定端點。
將端點前後延伸到低音量門檻值(t l )處。
再將端點前後延伸到過零率門檻(t zc )處,以包含語音中的氣音部分。
此方法用到三個參數(t u 、t l 、t zc ),若電腦計算能力夠強,可用各種搜尋法來調整這三個參數,否則,就只有靠觀察法及經驗值。此方法的示意圖如下:
The above improved method uses only three thresholds, hence it is possible to use grid search to find the best values via a set of labeled training data.
Hint 上述方法比較適用於語音辨識。若是為了旋律辨識,則我們不必考慮過零率,因為氣音本來就沒有音高,對旋律辨識不造成影響。
我們有一個端點偵測的函數,若對 sunday.wav 進行處理,得到的結果如下:
Example 3: epdByVolZcr01.m waveFile='singaporeIsAFinePlace.wav';
au=myAudioRead(waveFile);
opt=endPointDetect('defaultOpt');
opt.method='volZcr';
showPlot=1;
endPoint=endPointDetect(au, opt, showPlot); SAP Toolbox 裡面的 endPointDetect.m 函數,此函數即是使用音量和過零率來決定端點。
Now it should be obvious that the most difficult part in EPD is to distinguish unvoiced sounds from silence reliably. One way to achieve this goal is to use high-order difference of the waveform as a time-domain features. For instance, in the following example, we use order-1, 2, 3 differences on the waveform of beautifulSundays.wav :
事實上,我們也可以反覆使用波形的微分,再計算音量,就可以凸顯氣音的部分,例如:
Example 4: highOrderDiff01.m waveFile='singaporeIsAFinePlace.wav';
au=myAudioRead(waveFile); y=au.signal; fs=au.fs;
frameSize = 256;
overlap = 128;
y=y-mean(y); % zero-mean substraction
frameMat=buffer2(y, frameSize, overlap); % frame blocking
frameNum=size(frameMat, 2); % no. of frames
volume=frame2volume(frameMat);
sumAbsDiff1=sum(abs(diff(frameMat)));
sumAbsDiff2=sum(abs(diff(diff(frameMat))));
sumAbsDiff3=sum(abs(diff(diff(diff(frameMat)))));
sumAbsDiff4=sum(abs(diff(diff(diff(diff(frameMat))))));
subplot(2,1,1);
time=(1:length(y))/fs;
plot(time, y); ylabel('Amplitude'); title('Waveform');
subplot(2,1,2);
frameTime=frame2sampleIndex(1:frameNum, frameSize, overlap)/fs;
plot(frameTime', [volume; sumAbsDiff1; sumAbsDiff2; sumAbsDiff3; sumAbsDiff4]', '.-');
legend('Volume', 'Order-1 diff', 'Order-2 diff', 'Order-3 diff', 'Order-4 diff');
xlabel('Time (sec)'); 在上圖中,隨著我們對 frameMat 的一再微分,氣音的音量就會越來越明顯,因此可用來偵測氣音的存在。
在 SAP 工具箱內的 epdByVolHod.m 即是使用音量和 HOD 來進行端點偵測,請見下列使用範例。
Example 5: epdByVolHod01.m waveFile='singaporeIsAFinePlace.wav';
au=myAudioRead(waveFile);
opt=endPointDetect('defaultOpt');
opt.method='volHod';
showPlot=1;
endPoint=endPointDetect(au, opt, showPlot); 一般而言,同時使用音量及 HOD,可以對一般錄音進行不錯的端點偵測,但是此方法也有弱點,但環境雜訊太大時,此方法的正確率一樣會降低。
當然,還有很多時域的方法,就看你的巧思了!
Audio Signal Processing and Recognition (音訊處理與辨識)

